ASIC and FCA licensed Retail FX broker AETOS Capital Group have provided their daily commentary on traditional markets for April 15, 2019.
EURUSD
The Euro closed higher on Friday, closing at 1.1297(+38 pips) against the greenback. Sronger risk appetite boosted the EUR on Friday. The American dollar came under selling pressure amid resurgent risk appetite, which sent worldwide stocks to the upside. Major factor was the beginning of the earning seasons in the US, with JP Morgan reporting record revenues and profits in Q1.
Dollar’s slump followed an attempt to recover ground Thursday, which ended being reversed, so the currency reached fresh multi-week lows against most rivals, increasing the risk of such a move to continue. Further supporting the pair’s advance, EU Industrial Production fell by less-than-anticipated, down by 0.2% MoM and by 0.3% YoY, while the US Michigan Consumer Sentiment declined to 96.9 in April, according to preliminary estimates, from a previous 98.4.
The upcoming week will be a shortened one with most markets closed on Good Friday, as only Japanese markets will open that day. Nevertheless, there’s plenty of relevant data scheduled, with the most relevant being business activity updates in the EU, in the form of April preliminary Markit PMI. This Monday, there’s nothing scheduled in the EU, while the US will only offer the NY Empire State Manufacturing Activity, forecasted at 6.0 vs. the previous 3.7, and February TIC Flows.
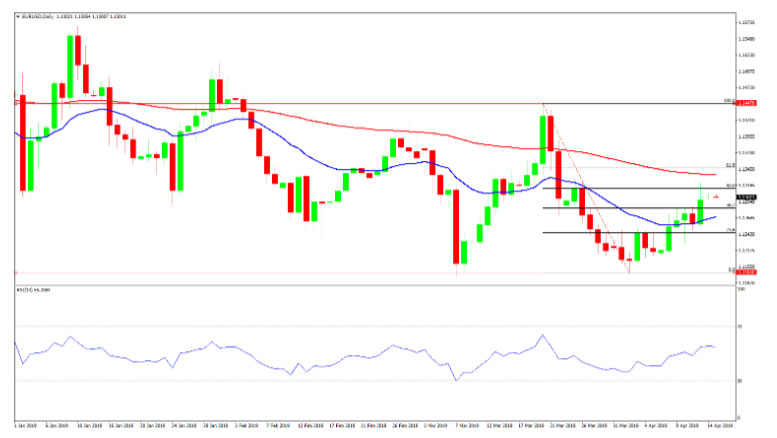
EURUSD Daily Chart
Based on the chart above, the EUR/USD pair has met resistance at around the 50% retracement of the 1.1447/1.1183 decline but held above the 38.2% retracement of the same slide at around 1.1285, the immediate support. In the daily chart, a long-term descendant trend line which comes from September high stands well above the current level, while a mild bearish 100 DMA (Red Line) converges with the 50% retracement of the same decline at around 1.1350. In the mentioned timeframe the pair settled above its 20 DMA(Blue Line), while technical indicators advanced, the Momentum still unable to enter positive territory and the RSI currently at 55, all of which leans the scale to the upside, although only above the mentioned trend line, the longer term bearish trend will be at risk.
GBPUSD
The Cable pair made positive gains to end last week as well, closing at 1.3072(+18 pips) against the greenback. Dollar’s broad weakness aided the cable pair to reach a high of 1.3132 on Friday, its highest for the week, although, once again, it was unable to retain the 1.3100 mark, ending the week barely up below the figure.
This past week, the EU granted the UK a Brexit flexible extension up to October 31, which means that the UK can leave earlier if a deal is agreed within the kingdom, something quite unlikely, as the Parliament had already rejected May’s deal three times. Nor May, neither the EU want to reopen negotiations to change the withdrawal agreement, while lawmakers won’t accept May’s deal. So far, the only thing all parts involved agreed on, is to avoid a no-deal Brexit, which provided some temporal relieve to the Sterling. But the critical issue that prevents reaching an agreement, the Irish backstop, remains unsolved.
Meanwhile, cross-party talks between PM May and opposition leader Corbyn aimed to break the Brexit impasse, headed nowhere, with Corbyn accusing May of sticking to her ‘red lines,’ and showing no real compromise. There are no macroeconomic releases scheduled in the UK this Monday.
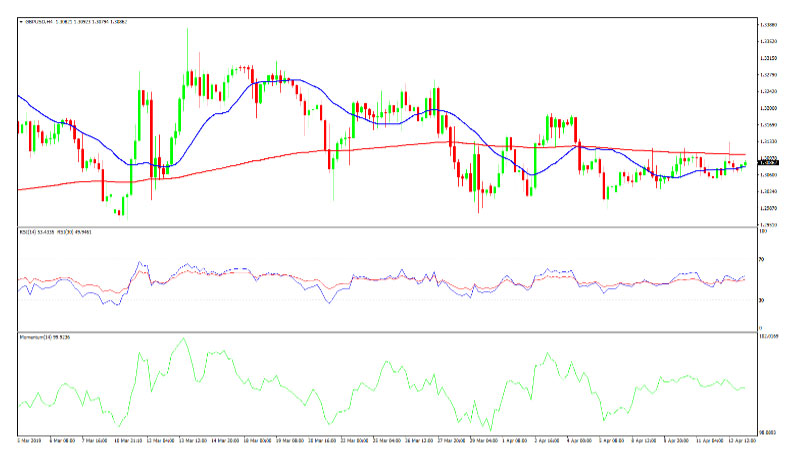
GBPUSD 4 Hour Chart
The GBP/USD pair has been consolidating within a well-limited range this last week, with speculative interest rushing to take profits out of the table once it reaches the 1.3100 region. In the daily chart, Friday’s rally met sellers around a daily descendant trend line coming from March high at 1.3381, also the 20 SMA(Blue line), gaining bearish strength at around 1.3125.
Technical indicators in the mentioned chart remain within negative levels, the Momentum aiming modestly higher an the RSI flat at around 53, offering a neutral-to-bearish stance. Shorter term, and according to the 4 hours chart, the price settled below a directionless 200 EMA(Red Line) and around an also flat 20 SMA(Blue Line), while technical indicators head south around their mid-lines, skewing the risk toward the upside.
Major Economic Events happening this week (AEDT Time Zone)
| Economic event (Date) | Previous | Forecasted | Actual |
| AU-RBA Meeting Minutes (16 April) | N/A | N/A | N/A |
| GB- Claimant Count Change for March (16 April) | 27K | 20K | TBA |
| DE- ZEW Economic Sentiment Index (16 April) | -3.6 | 1 | TBA |
| JP- Balance of Trade for March (17 April) | ¥339B | ¥310B | TBA |
| CN- GDP Growth Rate QoQ Q1 (17 April) | 1.5% | 1.4% | TBA |
| GB- Inflation Rate YoY (17 April) | 1.9% | 2% | TBA |
| EA- Balance of Trade for Feb (17 April) | €1.5B | €12.3B | TBA |
| EA- Inflation Rate YoY final March (17 April) | 1.5% | 1.4% | TBA |
| CA- Balance of Trade for Feb (17 April) | C$-4.25B | C$-3.5B | TBA |
| CA- Inflation Rate YoY for Mar (17 April) | 1.5% | 1.8% | TBA |
| AU- Unemployment Rate for March (18 April) | 4.9% | 5% | TBA |
| DE- Markit Manufacturing PMI Flash (18 April) | 44.1 | 45.0 | TBA |
| US- Retail Sales MoM March (18 April) | -0.2% | 0.9% | TBA |
| JP- Inflation Rate YoY for March (19 April) | 0.2% | 0.5% | TBA |
| US-Building Permits for March (19 April) | 1.291M | 1.3M | TBA |
*Pulled from Trading Economics website
Risk Disclaimer
The information above is of general nature only and does not take into consideration your objectives, financial situation or investment needs. The products and services provided are issued by AETOS Capital Group Pty. Ltd. (AFSL: 313016, ACN: 125113117). Trading Forex margin and CFDs carries a high level of risk, and losses can exceed your deposits. You are strongly recommended to seek independent financial advice before you make an investment decision. Please refer to our Product Disclosure Statement which you can obtain from our website for more details. AETOS has the ownership of the contents of this FX commentary. Copying, reprinting or publishing to a third party is not permitted.


