This article was submitted by Aaron Hill from FP Markets.
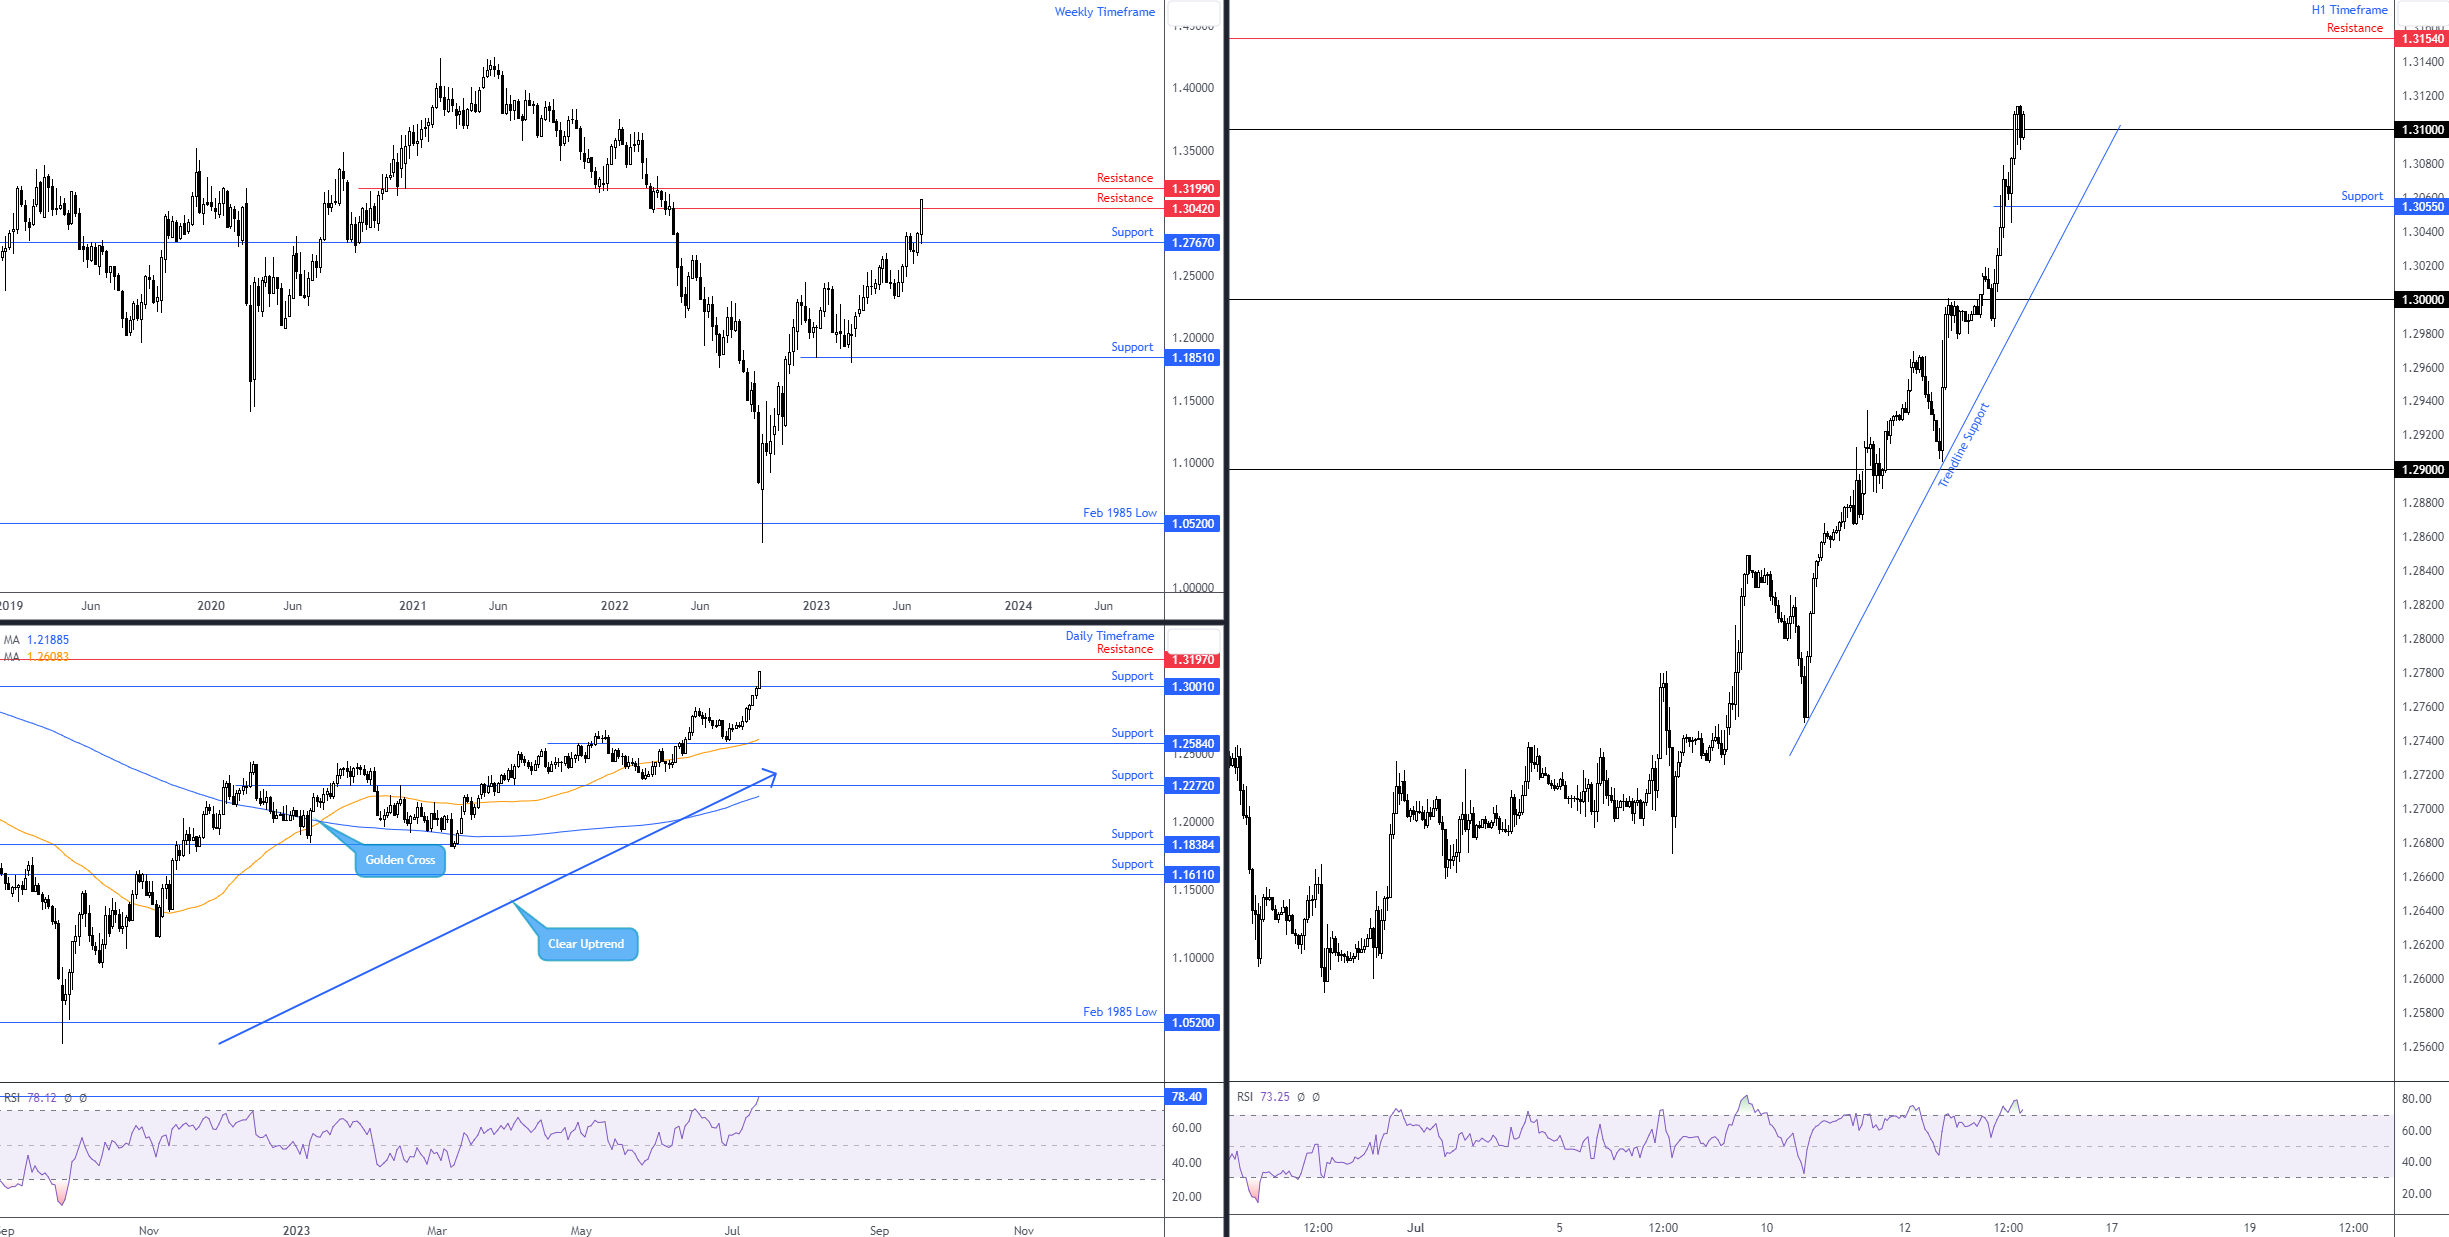
Against the US dollar, sterling is on a tear. WTD, GBP/USD is 2.0% in the green and clocking highs of $1.3114, levels not seen since April last year.
Despite economists projecting a more pronounced fall in real GDP in May (2023), economic output contracted by -0.1%, according to the Office for National Statistics (ONS). This follows 0.2% growth in April (2023).
This, alongside slower-than-expected US wholesale inflation data, provided the pound with some fresh legs today.
Higher Timeframes Show Room to Continue Pushing North
The weekly chart paints an impressive picture. After retesting a recently breached resistance at $1.2767, bulls went on the offensive and ran through offers at resistance from $1.3042. Neighbouring resistance at $1.3199 now calls for attention, which, technically speaking, offers a little more substance (historical significance). Ultimately, though, the weekly chart reveals that GBP bulls have room to manoeuvre for now.
Against the backdrop of the weekly chart, price action on the daily timeframe made short work of resistance at $1.3001 and is now closing in on another layer of resistance located just south of weekly resistance at $1.3197 (this type of resistance is referred to as a Quasimodo resistance). Interestingly, the Relative Strength Index (RSI) is considerably overbought at this point on the daily scale, challenging highs not seen since August 2020 (78.40).

 Charts: TradingView