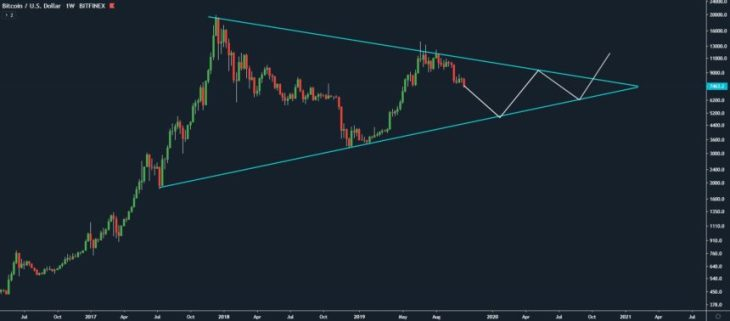
Bitcoin may has astonished critics across the globe with its nearly $2,000 run up in a single day, but there is one analyst that discounts any of its current movements or even the halving event next year. His premise is that a major run up will occur in roughly a year, as a result of a rather large pennant formation on BTC’s weekly chart. Teddy Cleps, a prominent cryptocurrency analyst on social media channels and U-Tube, is also a non-believer in the halving event, seeing it as already baked into the current prices.
Technical analysts sometime fall literally in love with the interpretation of their charts, a personal matter, which can get in the way, since emotions tend to cloud one’s judgment in the fast moving world of a trader. Can Cleps be right? Anything is possible in financial markets, and as we just witnessed, Bitcoin can achieve the impossible when least expected. Clep’s “interpretation” is not “way-out-there-weird” either. In fact, his pennant could be taken right out of a textbook for TA. Here is his basic premise:
As per this weekly chart, as first presented on NewsBTC, Cleps has drawn a perfect “pennant” in progress, with its resolution occurring out beyond October a year from now. In the past few years, we have heard and seen many “flags”, “converging triangles”, “pennants”, and even “symmetrical triangles”, but a standard pennant is a special breed.
To begin with, it is known for being a “continuation” pattern. Its “pole” from tip to tip is a measure of the breakout that can be expected later down the road in the same direction as the trend that preceded the actual pennant portion of the pattern, i.e., the reason why it is called a “continuation”. Yes, this formation wins the “Length” award. It did not begin to form until late 2016 and will not conclude until a year from now, when, hopefully, Bitcoin breaks north to somewhere near $30,000, if you do the math.
Cleps told NewsBTC:
What if the last run to 14k was just a lower high. If a massive pennant similar to the chart were to play out – it would take more or less 350+ days for a breakout/bull run.” He revealed his thoughts on the upcoming halving event in May of 2020 in a prior tweet: “I believe it’s already priced in – me, you and my grandma is aware of the halving! Unlike the previous one.
Cleps is not alone in this belief. Miners at a recent conference also expressed doubts that the “surge” that everyone expects may never arrive. As we have seen in the past few days and on several occasions beforehand, Bitcoin has a way of doing the direct opposite of what the “herd” is so certain of, a contrarian of sorts, if truth be told. Most analysts, however, do believe that upward price pressure could begin as much as six months before May.
One analyst in this group goes by the Twitter handle of “PlanB”. He is also known for using the “Stock-to-Flow” ratio as a model to project Bitcoin prices into the future. This ratio is typically used with other commodities to gauge how inventories of available to trade items compared to entire market quantities can vary over time. Bayern Landesbank in Germany recently used this model to justify its forward projection of BTC prices, too.
In the case of PlanB, he forecasts a $55,000 price, which would give Bitcoin a $1 trillion market cap and put it on a similar footing with Gold. Where would the money come from? Per PlanB:
People ask me where all the money needed for $1trn bitcoin market value would come from? My answer: silver, gold, countries with a negative interest rate (Europe, Japan, US soon), countries with predatory governments (Venezuela, China, Iran, Turkey etc), billionaires and millionaires hedging against quantitative easing (QE), and institutional investors discovering the best performing asset of last 10 yrs.
Here are two analysts that are “in love with the interpretation of their charts”, but have they convinced you, too? With Bitcoin’s latest breakout run, expect many more of these overly exuberant forecasts to appear in the weeks ahead. Hope springs eternal!

