The following article was written by Jens Chrzanowski, Member of the Management Board of Admiral Markets Group AS.
Hello,

Jens Chrzanowski, Admiral Markets
Markets are not perfect. There are times when you simply can’t make any money because the market won’t let you do it. The world of Forex & CFD trading has always been a battlefield. Traders often fight against the market, or each other. Some of the fighters will stand atop, and the others will fall. But there is more to trading than plotting against these elements. The real fight happens within each trader, and this fight decides the outcome of the war.
Sometimes not having a position in the market equals to having a profitable position. What you need to do is identify the market noise. This is exactly what we are going to do this week, based on an article of my colleague and analyst Nenad Kerkez. If you like to see him live, join our webinars for FREE any week.
EMA Spiral
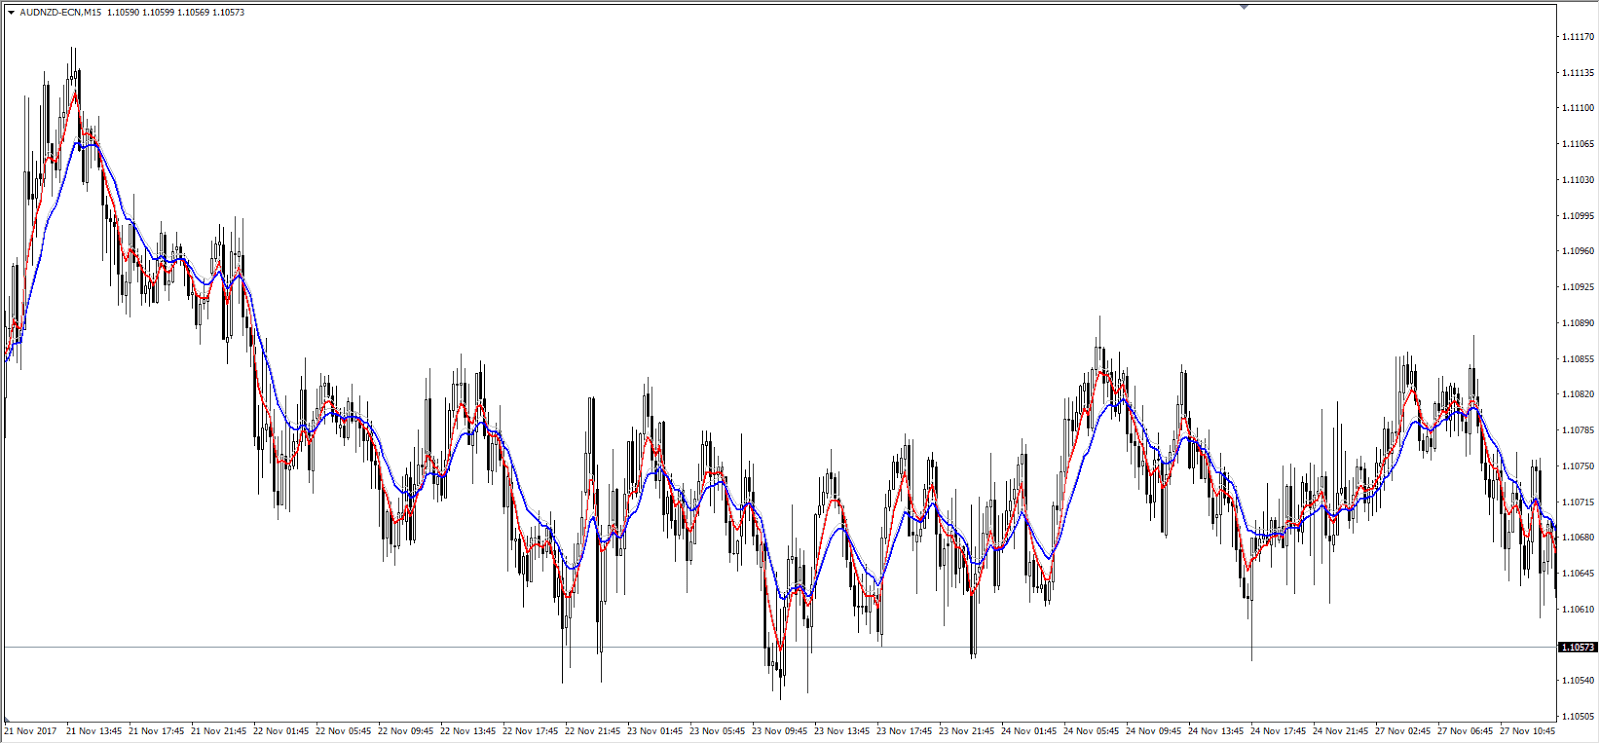
Source: AUD/NZD, M15 Admiral Markets chart, 5/13 EMAs attached, Nov 2017
The famous EMA spiral is a sure way to lose your account. It usually happens with short-term EMAs attached to a chart, e.g., 5/8 EMA, or 5/13 EMAs. The market is moving sideways, and EMAs follow it. However, when the price is oscillating within a small range, the indicators are forced to interpret the market in some manner, and you can get a lot of false trading signals that mean absolutely nothing. The chart looks like a DNA spiral, but we, traders, call it the EMA spiral.
Shark Tooth Pattern aka Whipsaw
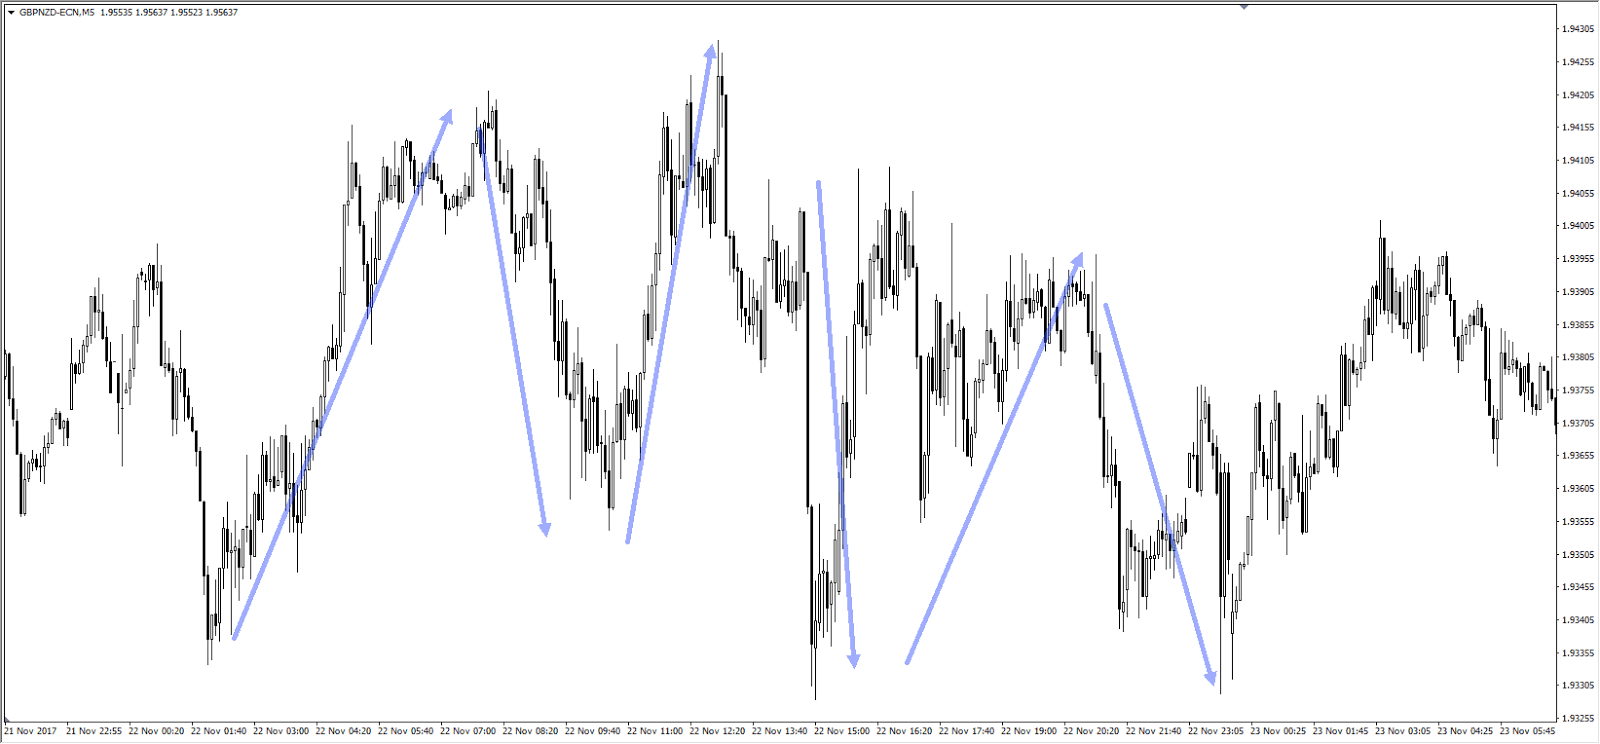
Source: GBP/NZD, M5 Admiral Markets chart, Nov 2017
Due to significant volatility, the market moves rapidly and sharply, making both highs and lows. The price action flow is very erratic, and the highs and lows may be entirely converged, even though the price moves quite a distance. It usually happens within lower time frames on volatile pairs. Have in mind that these moves can be extremely dangerous if spotted on H1 and higher time frames.
Marubozu Candle Entries
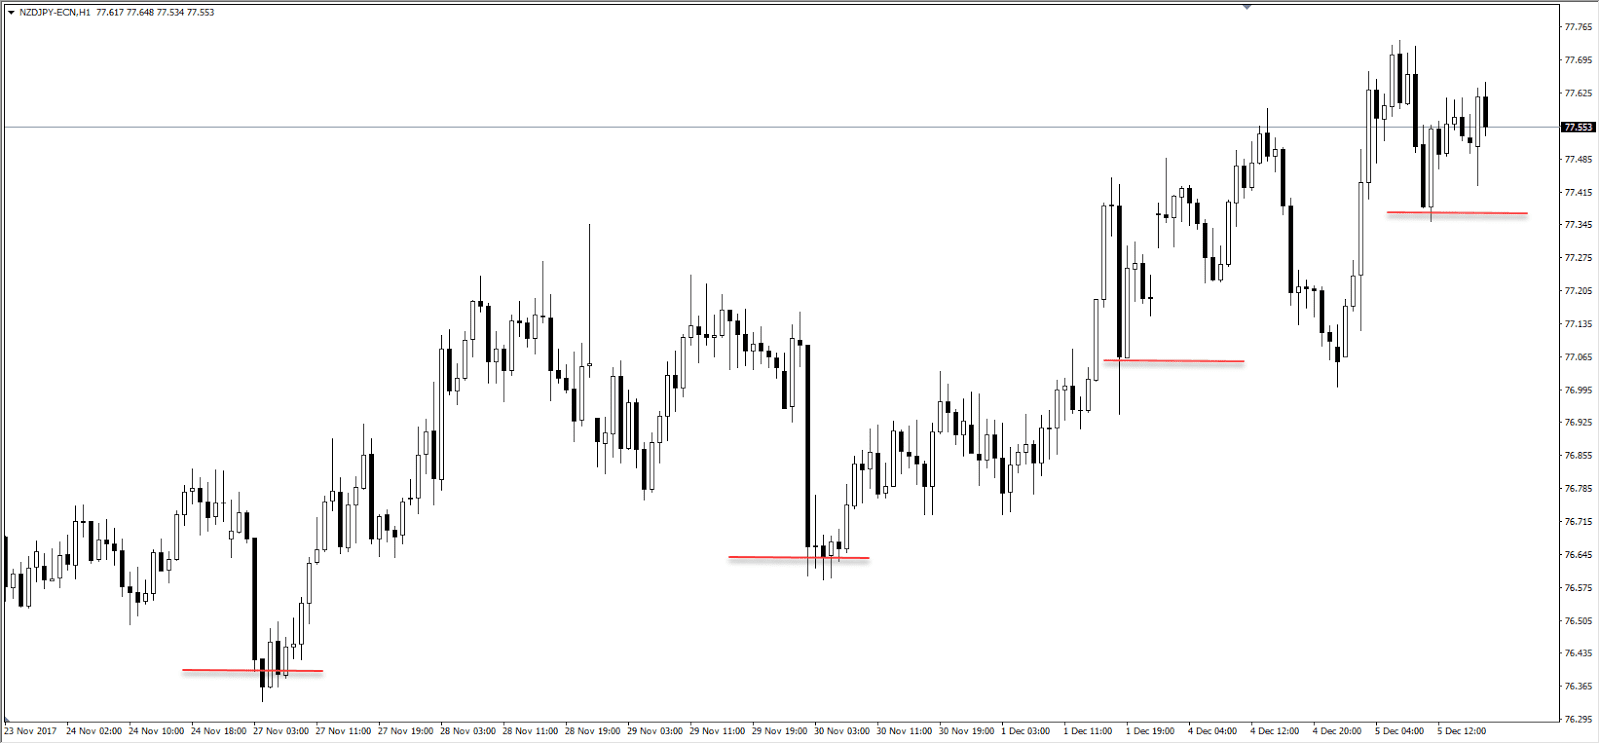
Source: NZD/JPY, H1 Admiral Markets chart, Nov-Dec 2017
Marubozu are a great tool to use for High Volatility Trading. If you decide to make an entry straight after a Marubozu has been formed, you might encounter a problem. When your entry candle is much higher than the average entry candle, your stop-loss should probably have to be too wide. Those large candles may have already used a lot of the move, which means that you will be jumping on a freight train.
Sawtooth Pattern aka No High/Low Defined
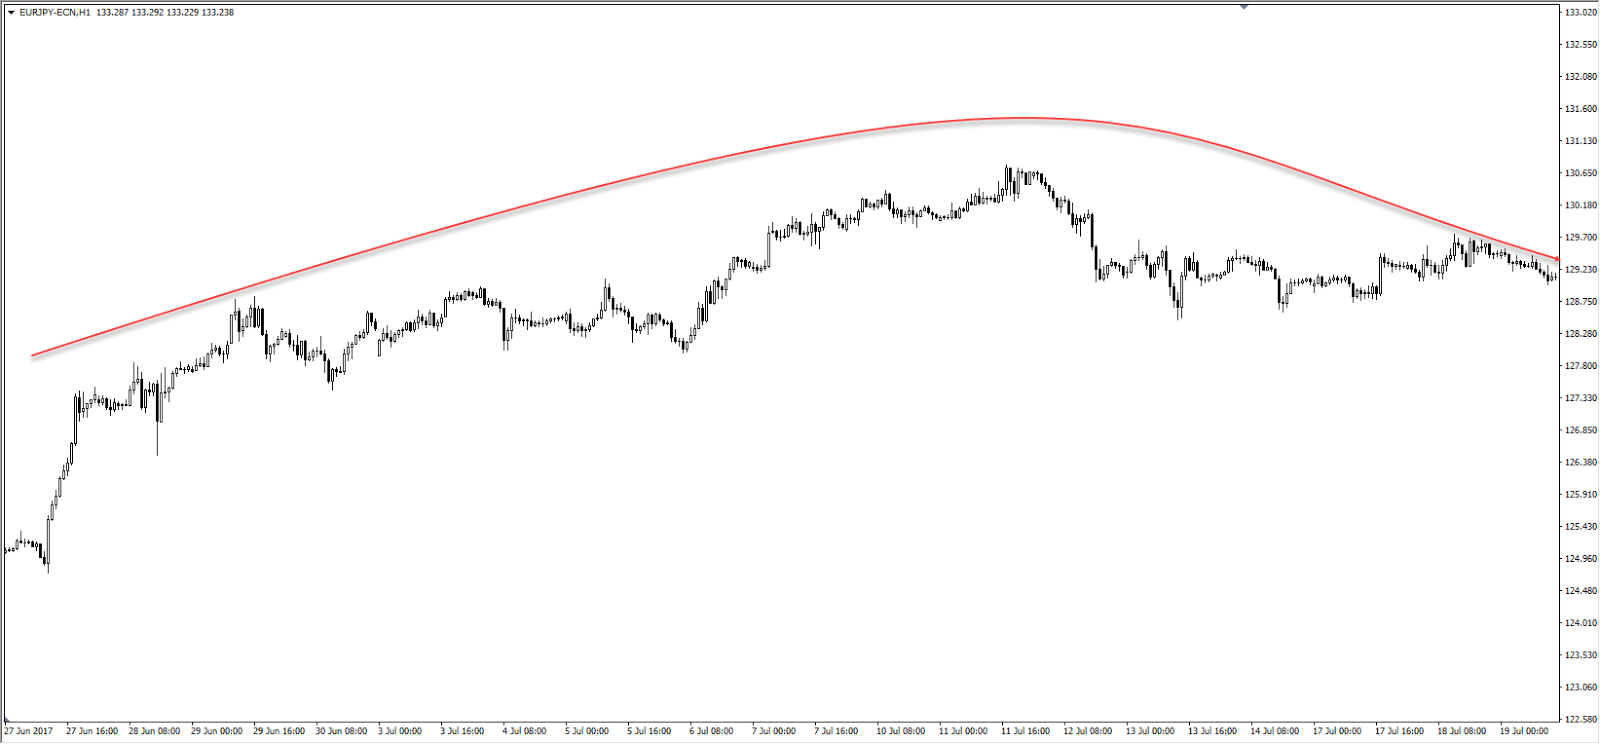
Source: EUR/JPY, H1 Admiral Markets chart, Jun-Jul 2017
When the price is moving in a tight range, without forming clear highs and lows, we say it forms a sawtooth pattern. There are multiple candle formations within the sawtooth, but these are no discernible highs or lows. You will probably be stopped out before you can even see what’s going on.
Sideways Chop
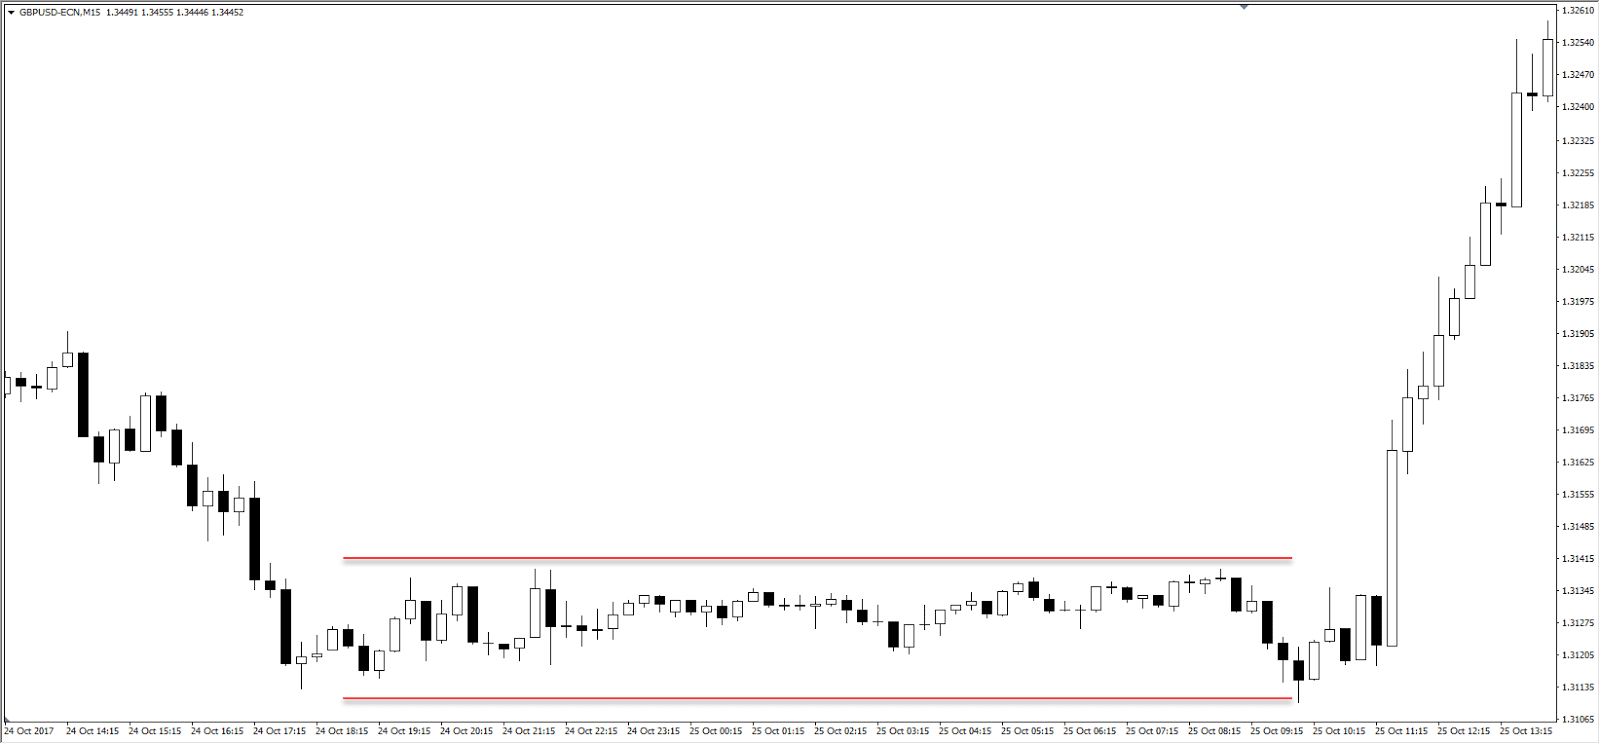
Source: GBP/USD, M15 Admiral Markets chart, Oct 2017
You will probably spot the markets moving sideways just before and after some critical news announcements, and, depending on the timeframe you are trading, throughout some days in the off-sessions, or EOD market trading (End-Of-Day). A sideways market chop is just what the name implies. The price is moving sideways making tiny candles which are undefined.
Eventually, this “pajama party” will come to an end, seeing one of the chiefs (e.g., head of a Central Bank) say something. The battle between bulls and bears will then ensue. When this happens and who gets the upper hand is hard to determine.
See you next week!
Do you have any feedback, concerns, requests, maybe even compliments? I’d love to hear them. Please contact me via: [email protected].
Trading on margin carries a high level of risk, and this article should not be seen as advice or solicitation to buy or sell, but written for informational purposes.

