Mati Greenspan, Senior Market Analyst at FX broker eToro, has provided his daily commentary on traditional and crypto markets for April 18, 2019. The text below is an excerpt and does not contain the full analysis.
Highlights include:
- Crypto Exchange Volumes Trending Away From Fiat: Crypto trading volumes are growing but the percentage of those volumes that are coming from fiat into crypto is shrinking
- Holiday Trading Could Bring Surprises: Trading volumes will likely be thinner through Monday, with traders out for the holidays. This could lead to more volatility.
- Traders Looking For Lower S&P Prices: Trading activity in the S&P 500 shows that its price is down during trading hours and up after hours, indicating that traders are looking for a lower price.
Regardless of religion or nationality, I think most people can’t help but feel emotional about the recent fire in Paris’s iconic Gothic Cathedral.
Nearly $1 billion has already been collected by four organizations responsible for the restoration of the Roman Catholic church, including from some of the world’s richest people and organizations.
Now it seems that even the crypto community is getting involved in the effort. Though the amounts collected so far are merely symbolic (0.23049983 BTC as of this writing), the idea is that global money should be easily allocated to raise capital and this is a prime use case for that.
France’s Minister for the Digital Economy, Cedric O, has been very bullish on blockchain so far and is extremely open to the idea….
In some countries, this sort of effort would be near impossible but at the moment France is demonstrating that they are a clear leader of mainstream crypto adoption in the European Union.
Mr. O’s keynote speech was one of the highlights of the ongoing blockchain week in Paris, second of course to Yoni Assia’s keynote that we highlighted yesterday and this awesome panel discussion (timestamp: 9:15) about how digital assets are integrating into the current financial system.
Traditional Markets
Trading is likely to be a bit wonky for the next few days. Tomorrow is Good Friday and Monday is Easter Monday, with the Jewish Holiday of Passover beginning tomorrow. Many investors and traders especially in Europe, Canada, and Australia will be out for a long weekend.
The world’s two largest economies, USA and China, will be operating at full capacity as they work towards a possible trade deal, in the hopes it will be agreed and signed in the coming months.
Three Black Spy Crows
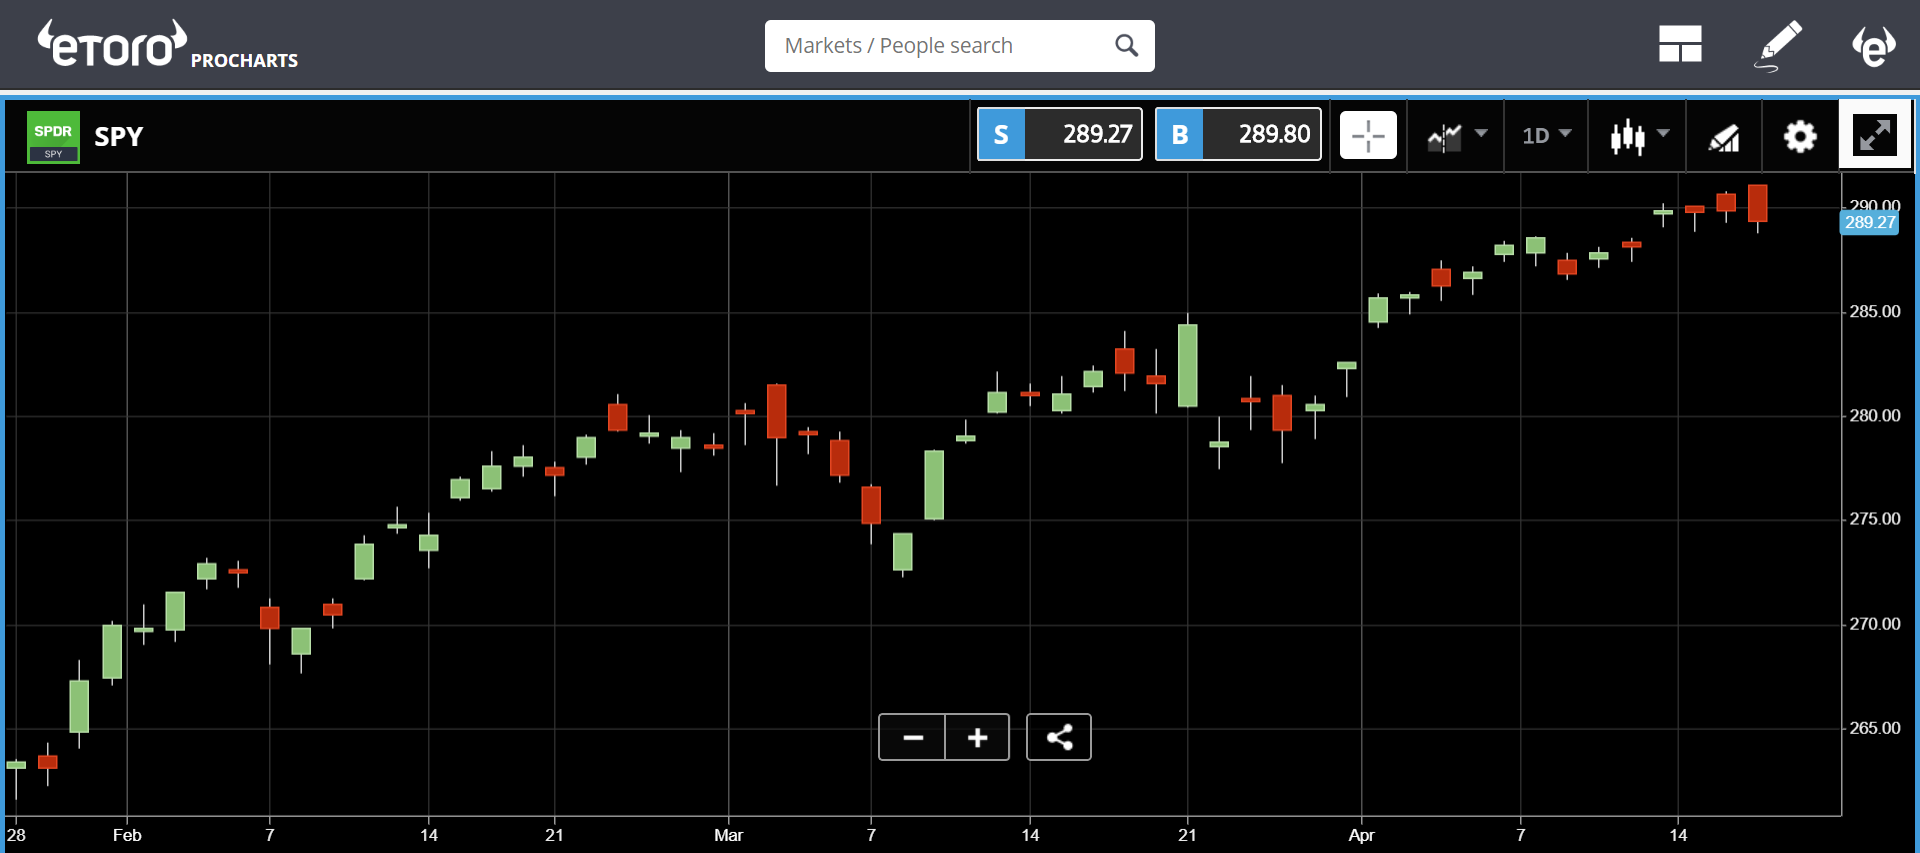
An interesting pattern has emerged on one of the charts that I think is worth highlighting. For those not familiar, the SPY is the largest ETF in the world and is designed to track the S&P 500. Needless to say, it’s pretty popular among traders and analysts looking to get a handle on the markets.
Here’s the chart, with each candlestick set to one day. Take a look at those last three candles.
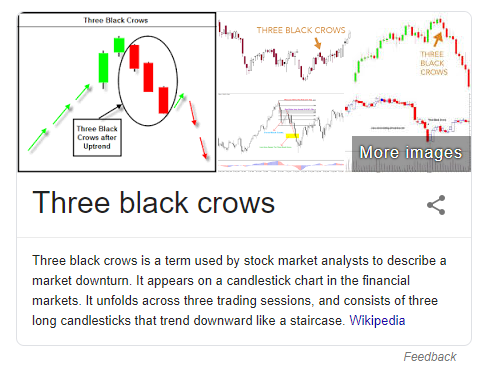
Even though they’re clearly red, this pattern is known often referred to as the three black crows and it usually represents a bearish turn in sentiment.
What’s interesting about the above graph is that even though all the last three candles are red, the opening price of each day has been higher than the previous one. So it seems that traders are clearly looking for a lower price, but the indices are being brought up after hours.
Just for fun, let’s go one step deeper here. This graph shows the SPY in candlesticks, and overlayed is the S&P 500, which it tracks in green. The S&P 500 actually trades 23 hours a day, while the SPY only trades during the US market open hours. So we can see a bit better how this behavior is playing out.
Crypto Consolidation
Crypto markets continue to consolidate the gains accumulated on April 2nd and the aftermath of that surge. By now, volatility and volumes have come down again and seem to be returning to their pre-April Fools day levels. As we said before, this sort of stabilization is quite positive at this point.
So, now should be a good time to take a closer look at what actually caused that massive surge in the first place.
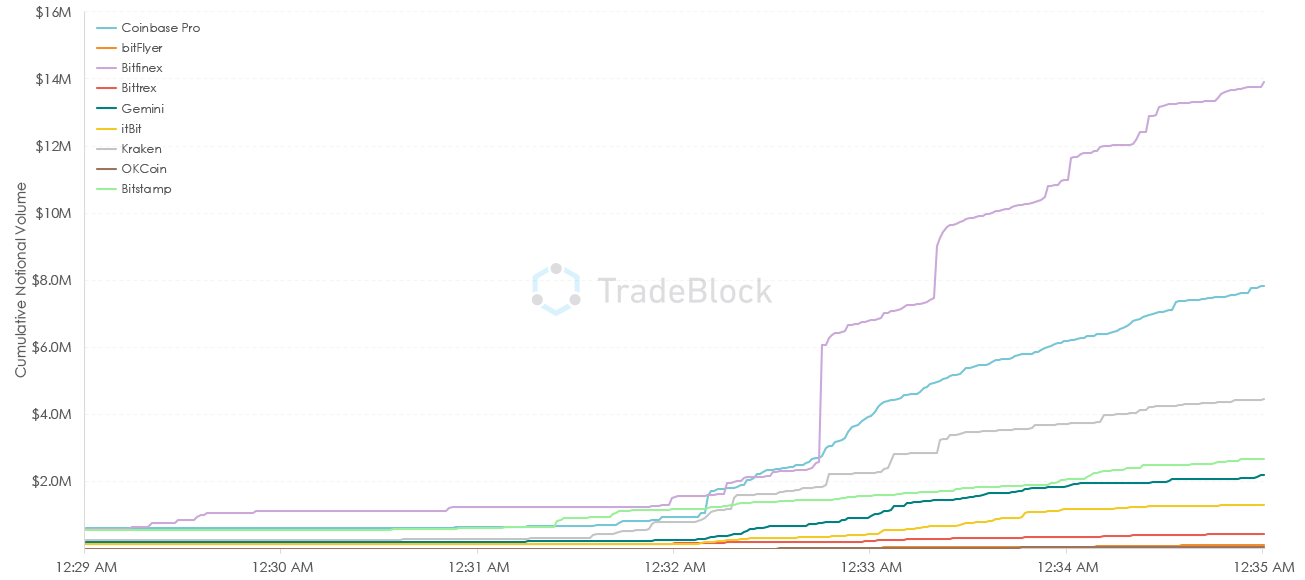
An interesting report from TradeBlock takes a deep dive into the order books across the top exchanges at the exact time of the surge. Here is one of the key graphs, which shows that volumes were highest on Bitfinex, Coinbase Pro, and Kraken.
The report refutes the claim that the surge was allegedly caused by a massive order that was coordinated on Bitstamp, Kraken, and Coinbase, saying that Bitstamp had nothing to do with it.
Still, to me, the narrative that this was about one large buyer was less about which exchanges exactly were involved and more about how many people were involved in moving the market. In addition, while a good insightful read, the report leaves a lot to be desired as it only examines exchanges that are available in the United States and, as we previously mentioned, the April 2nd surge clearly happened during the Asian trading session.
So we’re really no closer to finding out what exactly happened there. My opinion remains that this was a technical move caused by the break of the psychological resistance at $4,200, regardless of how many players were involved.
Another report came out yesterday that I thought was interesting. This one from Cryptocompare.com, which analyses the industry on a monthly basis.
Figure 6 shows the distribution of volume between crypto-to-crypto and fiat-to-crypto exchanges.
I thought this was interesting given that March was the height of altseason. Still, looking for a better view of this trend, the good folks at cryptocompare were kind enough to send me the following graph which shows the same stats since the start of 2017.
From the looks of it, the trend is pretty clear. Overall volumes are indeed growing but the percentage of volumes that are coming from fiat into crypto is shrinking over time.
It will be interesting to see how these numbers come out for April as that could give us a bit more insight into the April Fools surge.
Wishing everyone an amazing holiday and a wonderful weekend.
Mati Greenspan can be found on LinkedIn, Twitter, or etoro.
This is a marketing communication and should not be taken as investment advice, personal recommendation, or an offer of, or solicitation to buy or sell, any financial instruments. This material has been prepared without having regard to any particular investment objectives or financial situation, and has not been prepared in accordance with the legal and regulatory requirements to promote independent research. Any references to past performance of a financial instrument, index or a packaged investment product are not, and should not be taken as, a reliable indicator of future results. eToro makes no representation and assumes no liability as to the accuracy or completeness of the content of this publication, which has been prepared utilizing publicly-available information.


