The following article was written by AMarkets, a St. Vicent & the Grenadines (FSA) regulated global forex broker established in 2007.
One of the reasons why traders come to the Forex market is to ride a trend. Trend trading suits every investor type, as trends form on all timeframes.
Even scalpers (short-term oriented traders that buy and sell for a small profit) ride small trends on the lower timeframes. For swing-traders and investors, trends provide the opportunity to add to an existing position, by buying dips or selling spikes.
The worse thing that can happen to a swing-trader or investor is a sideways market. Even though the Forex market is one of the most volatile ones, currency pairs move differently.
Some pairs range more than others. It is known that crosses (the pairs that do not have the USD in their componence) tend to spend more times in ranges than other major pairs.
For this reason, trends do not form that easy. And, are not that often.
But when they do form, they provide tremendous opportunities for the trading account to grow. Especially when they form on the big timeframes.
What Makes a Trend
A trend is not a straight line. Instead, when the market trends, it forms a series of lower lows and lower highs (in a downtrend) or higher highs and higher lows (when the market forms an uptrend).
Even the strongest trends have their pullbacks, so understanding the series described above is essential. As long as the series hold, the trend won’t stop, and riding it is the way to go.
But this is a technical analysis concept. The pullbacks in a trend are determined by fundamental changes. Be it economic news or news of different nature; they test traders’ strategies. Some traders close their positions to book the profit when some other ones use the pullbacks to enter a new trade.
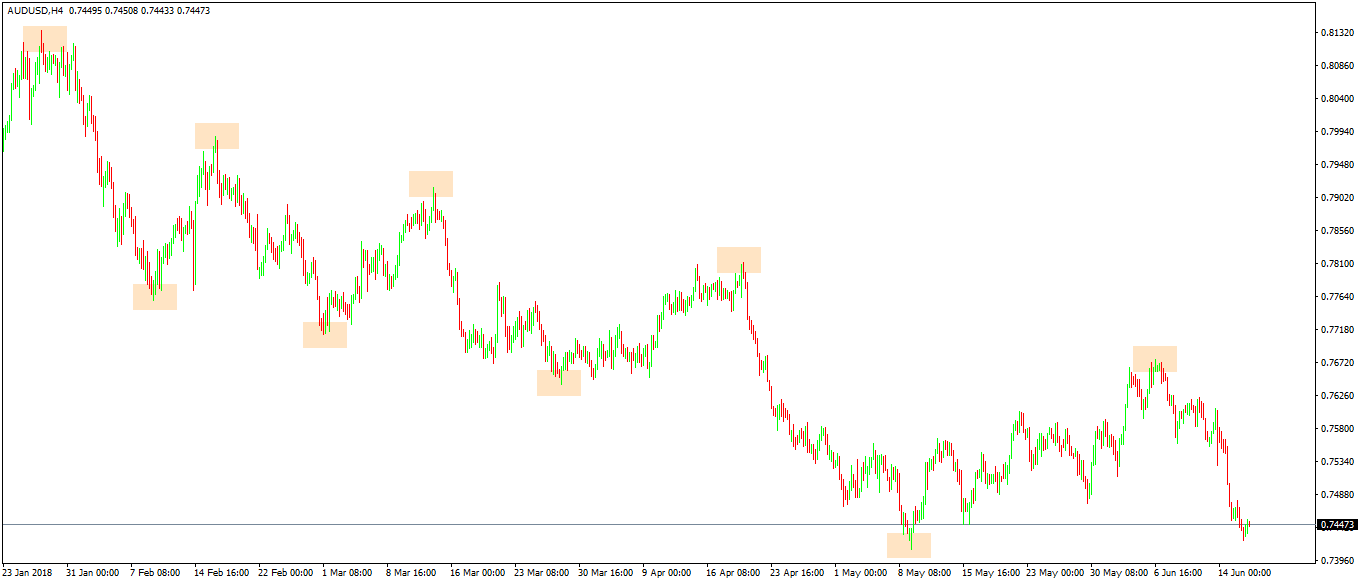
Take the AUDUSD for instance. For the entire 2018, it traded in a bearish trend that started above 0.81.
It keeps forming a series of lower lows and lower highs, and for as long as these conditions hold, the trend will keep on going.
How to make use of this series?
Building the Line of the Trend
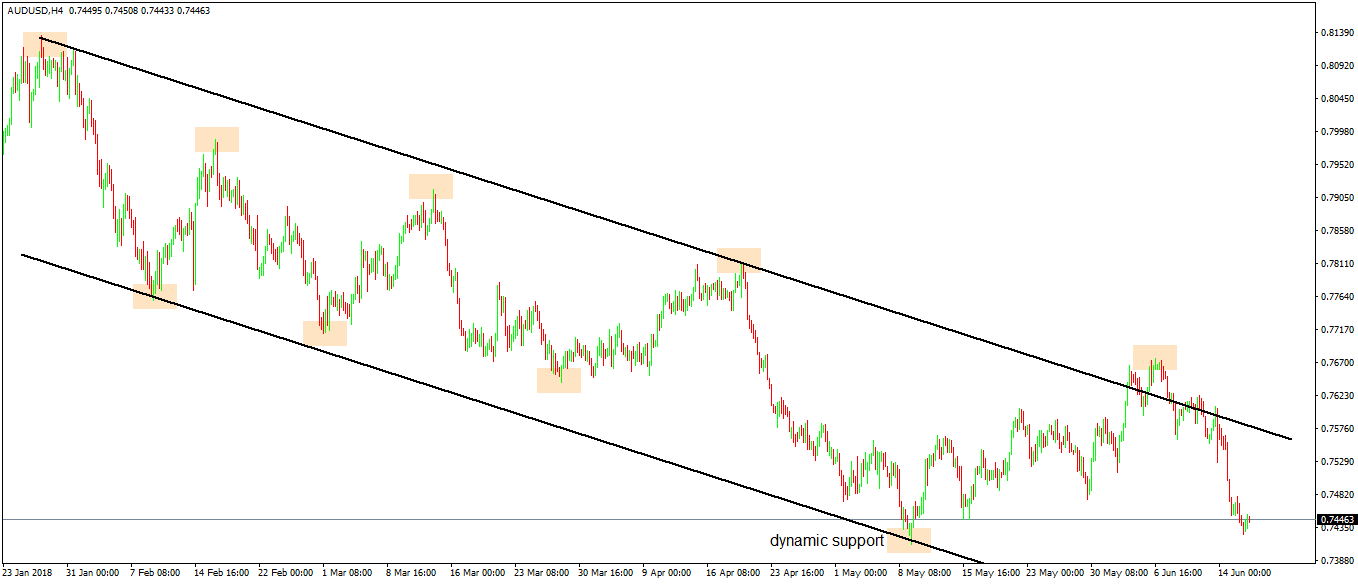
The trendline, or the line of the trend, connects the lower highs in such a way that defines the trend. Traders use it to project a channel so that they have an idea when and where the lower lows will have dynamic support.
While the price did break the upper side of the channel, it turned out that it didn’t influence the trend. For the trend to be broken, the price must break the series of lower highs, which didn’t happen yet.
Conclusion
Trends and trendlines show the market direction. Traders use them to make sense of the market’s volatility.
As a technical analysis tool, the trendline keeps a disciplined approach to trading. When combined with the series of lower lows and higher highs, it proves to be quite a powerful trading tool.


