The following article was written by AMarkets, a St. Vicent & the Grenadines (FSA) regulated global forex broker established in 2007.
Open your account history and analyze all losing trades. I’m 95% certain, most of your trades are open in the opposite direction, in other words, where you need to buy, where the most that is not the bottom of the market, you sell, and where you need to sell, you can say the top, you bought.
After all, you agree, you know in advance that the price is approaching to the very bottom, would you sell? Yes, of course not, and if so, you would be able to filter out a whole mountain of losing trades.
In today’s article, I’ll talk about divergence and convergence, these two words will turn your trade upside down. After reading the article to the end and starting to use the methods proposed in it, you will be able to unmistakably detect a clear imbalance in the market and play on the side of the strong.
After reading the article to the end, you will learn:
- Determination of divergence and convergence;
- Consider the types of divergence;
- Let’s get acquainted with indicators and oscillators for finding divergences;
- I’ll tell you how to correctly determine the divergence and what errors can be;
And i will summarize.
The definition of divergence and convergence
From the theoretical part, previously written by me articles, and simply from life experience, a trader should understand that the movement can only continue until the fuel is poured into it. Hence, probably sooner or later, there will come a time when all players will be in the market and push the price further, there will be no one else.
Similar situations have a place to be and this is not uncommon, they are called overbought:
Overbought – the situation in the Forex market, CME, shares, when all who wanted to buy and even more, have already bought and push the price higher there is no one else.
…and overselling:
Oversold – the situation in the Forex market, CME, shares, when all who wanted to sell and even more, have already sold and push the price lower there is no one else.
Overbought or oversold is not created from scratch. We all know and see that the price is moving in certain waves. Each trader classifies each wave for himself, but the meaning remains one.
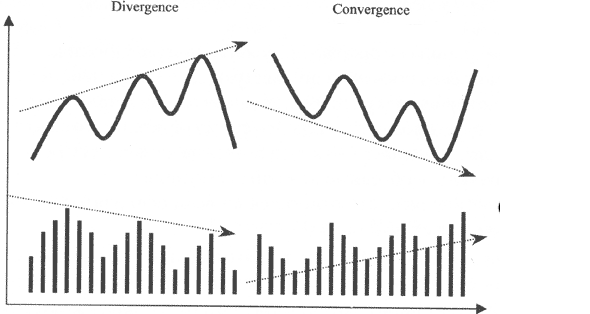
At times when the indicators or oscillators differ from the real price chart, they are called for the bear market, convergence, for the bullish market divergence.
Both these words came to us from the Latin language and are translated literally as:
- Divergence (from the Latin divergere) – to detect the discrepancy.
- Convergence (from the Latin convergo) – to find rapprochement.
Important !
In different chats, it is very rare to find traders who are perceptive about every word and definition behind it, so divergence and convergence are usually called one, single word “divergence” or “divorce.”
Divergence (actual and for convergence) is divided into two types:
- Classical divergence / convergence.
- Hidden divergence / convergence.
Classical divergence
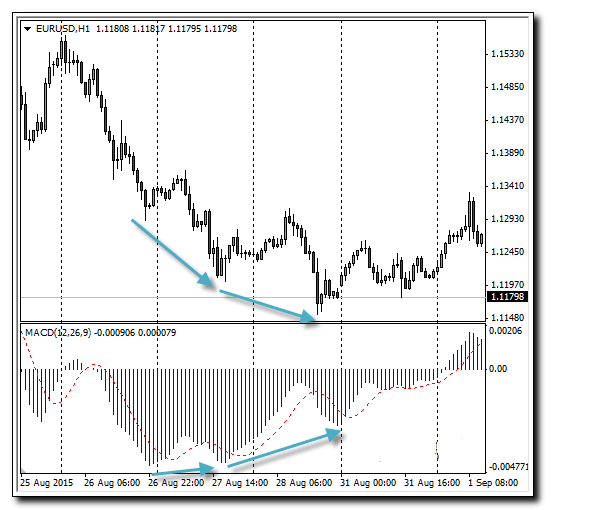
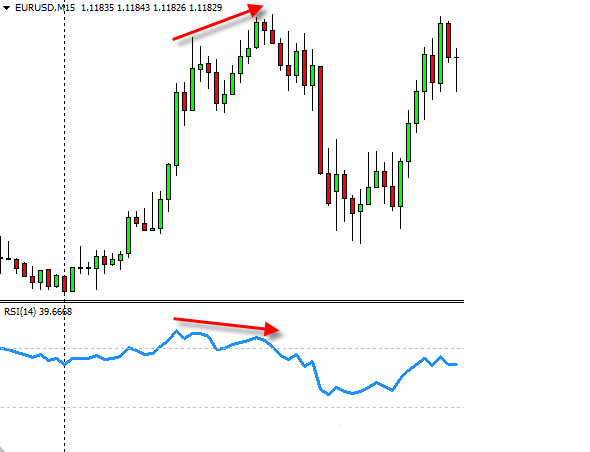
To find the classic divergence, it is enough for the trader to compare the update moments Hi on the price chart, with similar moments on the indicator or oscillator.
As soon as the price chart again updates its peak, while the indicator could not do this, it means that we have identified a divergence, which means that the market is overbought and try to make money on the Buy position, it is not advisable.
The classic divergence of the authors of books for traders is thoroughly disassembled, explaining that the divergence comes when the price once again updates its peak, and the indicator algorithms do not see the grounds for this movement and are already beginning to draw counter-movement, but there are other variations on the market that are so the same can be attributed to the classical.
Classical divergence Class A
Under number 1, perhaps I will leave the most common divergence described in the figure above. While the value of the asset once again updates its Hi, the indicator refuses to believe in such a quickness of customers and is already beginning to unfold, thereby pointing the trader to a divergence and anticipating a reversal.
Classical divergence Class B
This kind of divergence resembles Class A, except that this time the asset price could not interrupt its Hi, drawing a reversal pattern Double top, while the indicator did not reach its highs.
Classical divergence Class C
In the case of Class C divergence, the price updates its peaks, but now the indicator draws a figure Double top.
Dealing with classical divergences, we see that the signal for a turn appears at the moment of the indicator’s divergence and the real price. If the analysis does not take into account the market background, and rely solely on the discrepancy, then according to statistics, the divergence of Class A gives the strongest reversal signal from the presented.
Triple Divergence / Convergence
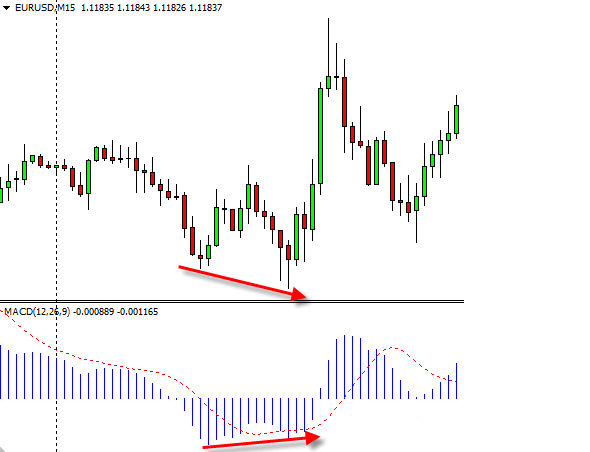
In the above examples, only double divergences were taken into account, but in some cases, the peak of the double divergence is updated again, creating an enhanced reversal model called the triple divergence (convergence).
Very often, a triple divergence can be detected during the news release. The principle of work is the following: using a signal of classical divergence, traders open a purchase.
During the release of strong news, at a time of increased volatility, there is a collection of stops, or as many say, the dumping of unnecessary passengers, updating the previous Low on the price chart. At the same time, the indicator’s algorithm does not see any reason to update its peak and draws upward movements, thereby creating a triple divergence.
Together, having received a reversal formation of a triple divergence, the trader has every reason to believe that the downward movement is over and open a long-range order.
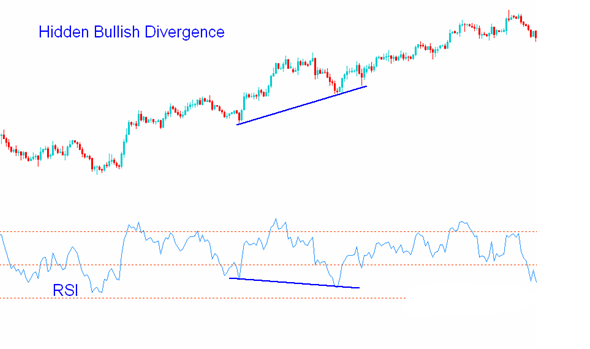
Hidden (reverse) divergence is not so common, but still it should not be forgotten, as this is a very strong signal for the continuation of the trend.
Hidden (reverse) divergence is not so common, but still it should not be forgotten, as this is a very strong signal for the continuation of the trend.
In the figure above, the growing market is clearly visible, but the RSI indicator shows a new bottom. This discrepancy indicates the presence of a hidden bull divergence and signals the strengthening of the UP-trend.
Indicators and oscillators for finding divergences / convergences
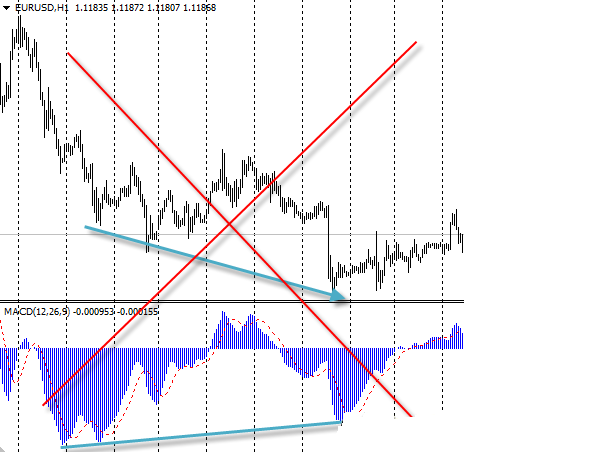
Selecting the indicator, we must take into account that the name of the oscillator MACD stands for divergence and convergence of moving averages. It turns out precisely this indicator, was invented for the exact definition of divergences / convergences. In addition to MACD, Stochastic and RSI can help in the search, for which the hidden divergence is well defined.
Proceeding from this, it would not be logical to recommend any specific, let alone impose something own. Test each indicator yourself and select for yourself only one and trade based on its signals, not paying attention to the rest.
Further on the article, I will show how to determine the divergence using indicators.
MACD Oscillator for Divergence / Convergence Search
MACD is an interesting oscillator that can do a lot, including helping to find “divers”. The indicator is used with the standard settings:
- Fast EMA: 12;
- Slow EMA: 26;
- MACD SMA: 9.
One of the most important rules, with divergence, the oscillator columns should not cross the zero mark.
Oscillator RSI for divergence / convergence search
The RSI oscillator has zones> +100 and <-100, which are called oversold and overbought zones, respectively. The signals received at the time the indicator is in these zones are considered strong, and even if this signal is a divergence, the probability of a positive outcome increases many times.
The divergence of price and volume (volumes)
Volume is the defining indicator and the essence of the divergence between price and volume is reduced to the following idea:
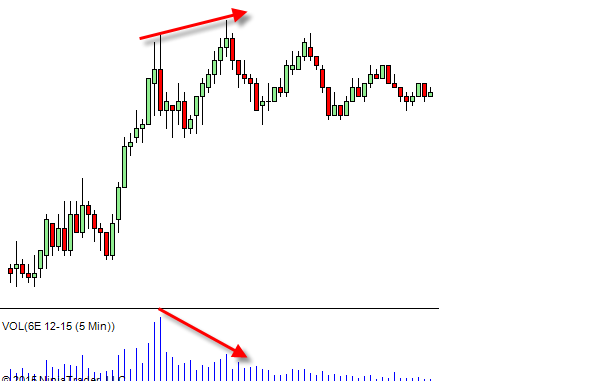
The upward movement continued until the moment when all the new and new volume was poured into the market, and the volume as we understand it, is nothing more than pre-purchase.
At the next breakdown of Haya, we see a significant decrease in volume. It turns out that customers stopped pouring money. Hence we can conclude that once the buyers run out of money, the price will go down.
Important!
Divergence / convergence is the strongest reversal signal, but not 100%. When opening a deal, do not exceed the risks.
How to correctly determine the divergence
This section, I want to tell a little about the mistakes that traders often allow trying to find a divergence / convergence.
Follow the divergence / convergence search rules
- There must be a trend, the divergence does not work in the flat.
- If the market is up-trend, look for a discrepancy between the price and the indicator that is present in the hai.
- If the market is down-trend, look for a discrepancy between the price and the indicator, which is present in the loyas.
- It is generally believed that the divergence works exclusively on the older timeframes, but the examples given by me in the article show that it is not forbidden to trade on junior timeframes.
- Working with divergences, confirm your inputs with proven patterns from PriceAction or Japanese candles.
- Do not expect that you found a 100% turn. There is always the possibility of making an error. Therefore, trading in the Forex market, it is necessary to work with stops.
- Do not trade on the news. Due to high volatility, during the news, the most proven trading strategies very often fail.
The sought divergence must be explicit
The technical analysis, which includes the divergence / convergence considered in this article, is a very powerful tool that can determine the moment of the market’s turn with an accuracy of several points.
Why is this happening?
The thing is that all the fibo levels, trend lines, resistance, support and all the rest, works only because they are seen by EVERYTHING. The crowd, albeit stupid, but in a single rush it is a powerful machine capable of moving the market.
We need obvious divergences, you must be sure that the divergence you filter, see everything, only in this case the probability of winning will increase.
Match only the nearest peaks / depressions
It is important to find the discrepancy between the nearest peaks. It does not matter what the indicator shows in a period of several days, let alone weeks, if we trade a 5-minute chart.
Crossing the zero mark, cancels the signal
Studying long ago divergences, I drew knowledge from books, where I often met an example of a divergence, which in essence should not work. I admit the fact that the authors of the books described the working moments of their time, but now, crossing the zero mark with the indicator, cancels the signal.
Let’s sum up the results
That’s probably all that I wanted to say about the divergence / convergence. Certainly, the knowledge and ability to use the convergence / divergence will add pluses to your piggy bank. I tried to tell everything I know myself and even opened a little secret.
Pick up an indicator with which you will work, practice on the charts, look for self-reversal moments and introduce the acquired knowledge into your trading strategy.
