As the week draws to a close markets are beginning to consolidate. However looking across several of the major markets there is a sense that near term moves have reached a series of crossroads. The next move could determine whether the risk recovery is set to continue, or take a cautious reverse once more.
The Trade Weighted Dollar Index is under pressure.
The primary uptrend of the bull market that has been progressing since May 2014 comes in today around 98.5. Whilst the correction in the dolalr over the past few motnhs has been a correciton within the primary uptrend, technically the pressure is on. The big five month top pattern completed below 99.2 and has spent the past week consolidating the pattern completion. The pattern implies 94.7/96.2 depending on the severity of the downside pattern projection. This comes as the uptrend is approaching. As expectations of Fed tightening have receded in recent weeks amidst weaker US data and disappointment over Trump’s ability to get his plans through, this is a key time for the dollar. A continued decline would begin to question for a potential corrective move back towards 97.50 or perhaps the 2016 pivot around 96.0.
EUR/USD is holding on to the breakout support at $1.0850.
The euro is a major weighting in the Dollar Index (c. 58%) and as such movements on the euro have a significant impact on the hanging on to support at $1.0850. This support is a long term breakout level and neckline of a large base patternt that implies around 500 pips of additional upside which could mean $1.1350 is seen during 2017. How could this happen? Well, although the market reacted negatively to the ECB yesterday, there was a sense that the Governing Council is preparing for a less dovish stance to wording in the statement next month. Analysts expect tapering to begin in Q1 2018, with rate normalisation to follow in 2019, however there is a hawkish risk to this and there could be a dramatic reaction on the euro as the Governing Council begin to discuss these possibilities.
Dollar/Yen testing the resistance band 111.60/112.20.
This is another statement of positive risk sentiment. The resistance band 111.60/112.20 would mark a change in outlook is broken to the upside. It would be a key break higher and put the pair back into the 111.60/115.60 range. It would need to be accompanied by the daily RSI pusing consistently abvoe 60 and preferrably the MACD lines rising consistenly above neutral. For now this resistance band remains intact and I prefer a strategy of selling into strength, however this strategy would need tweaking if 111.60/1112.20 were to be breached.
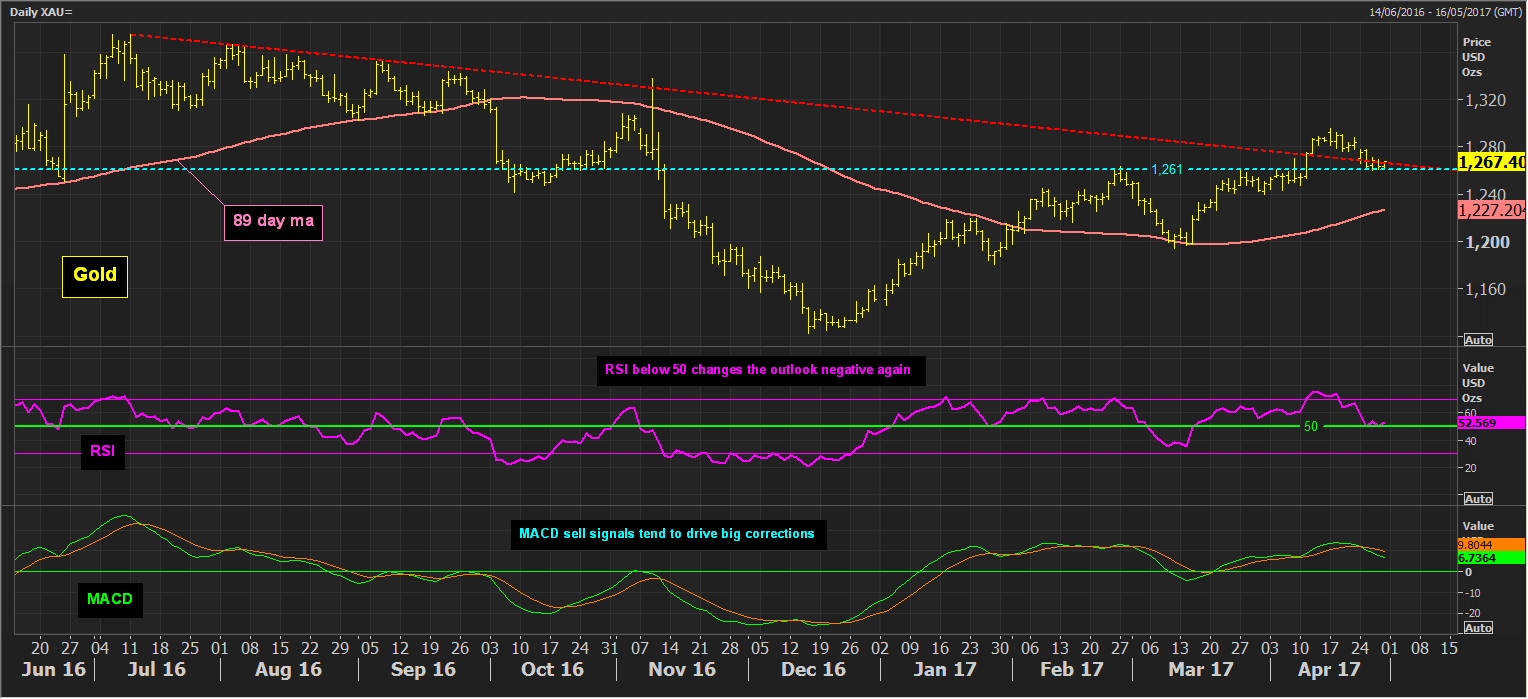
Gold is testing the $1261 support.
This is the confluence of the $1261 support of the old breakout highs from March/Apriland the old 10 month downtrend. A closing breach would re-open the old $1240 pivot. So far this week the support around $1261 has held very well (aside from a brief move to $1259.90) and whilst momentum indicators are corrective near term, they retain a positive medium term configuration. However MACD sell signals have tended to drive medium term corrections and the RSI below 50 would add downside moentum. Although the French election is seemingly less political risk now, gold is supported by safe haven demand by geopolitical risk on the Korean Penninsular. Furthermore, the dollar weakness amidst underwhelming US data has been supportive. However, can this support continue to hold if US GDP surprises to the upside today? Next week we have the May FOMC meeting in addition to payrolls. This will add to the risk of a break below $1261, however the confirmation of the move would be below $1240, a breach of which would risk a move back toqwards $1200 aagin.


