The following guest post is courtesy of ATFX Global Chief Market Strategist Alejandro Zambrano.
The Chinese stock market is under pressure and from its 2019 high of 14237.2 the China A50 index had slid by 12.55% at the time of writing.
Chinese stock markets have much like its European and U.S. peers been thriving since the start of the year, and on April 19 the index was up by a staggering 39.4%, as it looked like the US and China would reach a trade agreement. However, since April 19 the direction has only been downwards for the index.
The prospects of a completing a deal before tariffs on China imports are increased on Friday midnight Eastern time, is looking remotely as the China Ministry of Commerce said China would retaliate if the U.S. increased duty as planned. Also, a professor of the Chinese Academy of Sciences, who is also an adviser to the Chinese government said that if China would give up on subsidizing parts of its economy it could be suicidal.
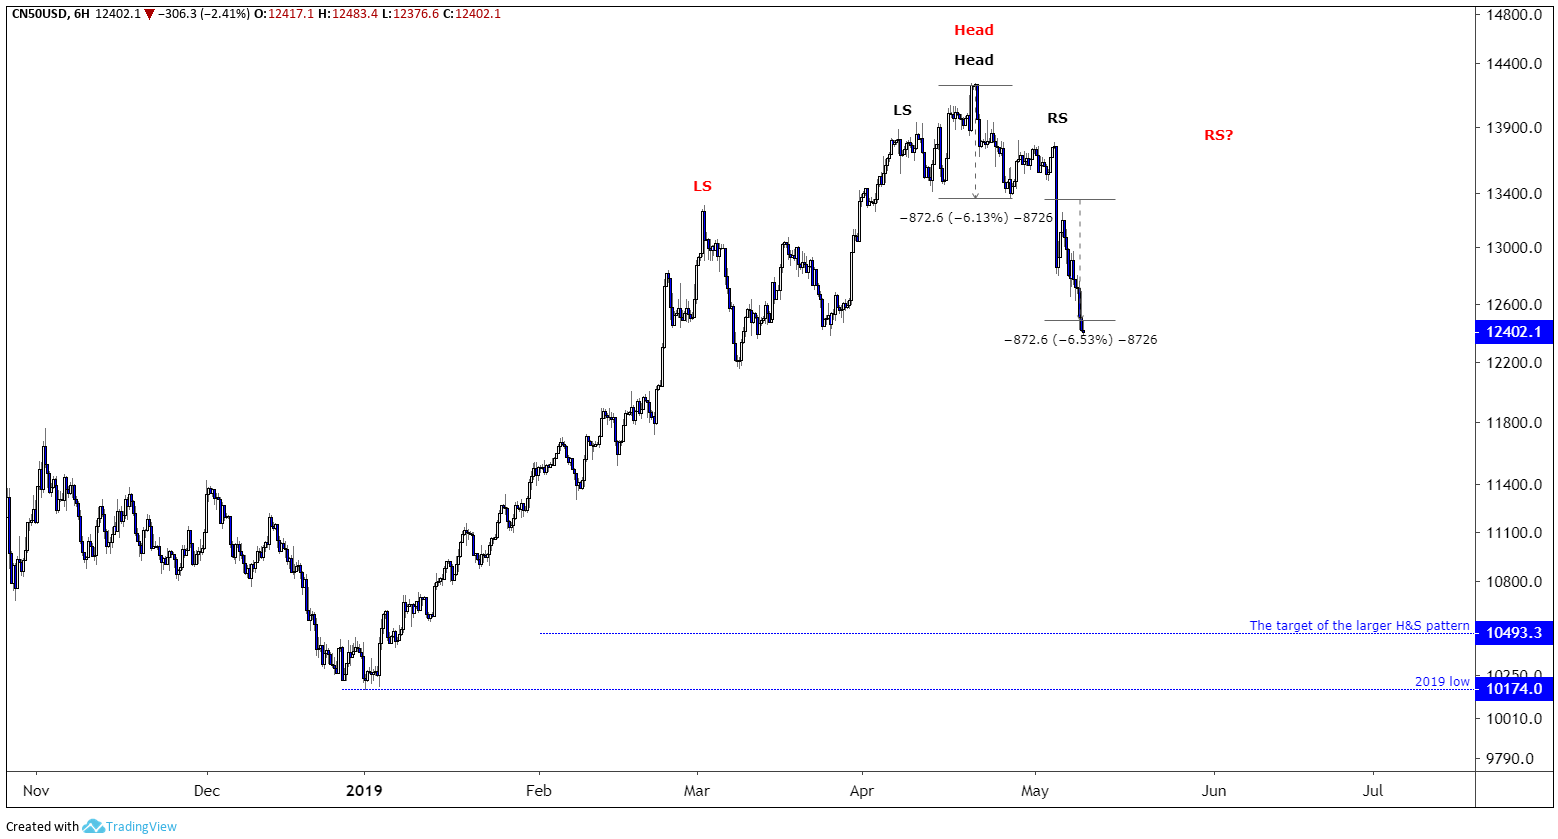
As for the technical analysis, the China A50 has now reached its target based on the head and shoulders pattern formed in April and triggered on May 6. As the price has now reached its target it would be fair to anticipate some profit taking.
However, it is not very hard to imagine another wave of selling following a bounce in the index if tariffs are indeed increased. The chart suggests that the latest slide in the China A50 might be the start of a right shoulder of a much larger head and shoulders pattern.
In the chart below I have depicted the smaller head and shoulder pattern with black annotations, while the red annotations show what could be the larger head and shoulders formation. In the larger pattern, the March 4 high is the left shoulder, while 2019 high is the head, and the right shoulder is still to be created. If the larger H&S pattern indeed plays out over the next few weeks, then I currently estimate that it might the China A50 to test it’s 2019 low.
Positions are very fluid in global politics, and President Trump might change his mind in the next few hours. A delay to the introduction of new tariffs should be able to stabilize the China A50, while a deal should will probably be able to turn the index around and negate the current bearish outlook.
China A50 Six-hour Chart
Risk Disclaimer:
CFDs are complex instruments and come with a high risk of losing money rapidly due to leverage.71% of retail investor accounts lose money when trading CFDs / Spread betting with ATFX. You should consider whether you understand how CFDs / Spread betting work and whether you can afford to take the high risk of losing your money.
This market update was provided with an educational purpose, and is the personal opinion of Alejandro Zambrano, and not to viewed as trading advice by ATFX or Red Castle Ideas LTD.

