This article was submitted by Aaron Hill from FP Markets.
Higher Timeframes Showing Lack of Nearby Resistance
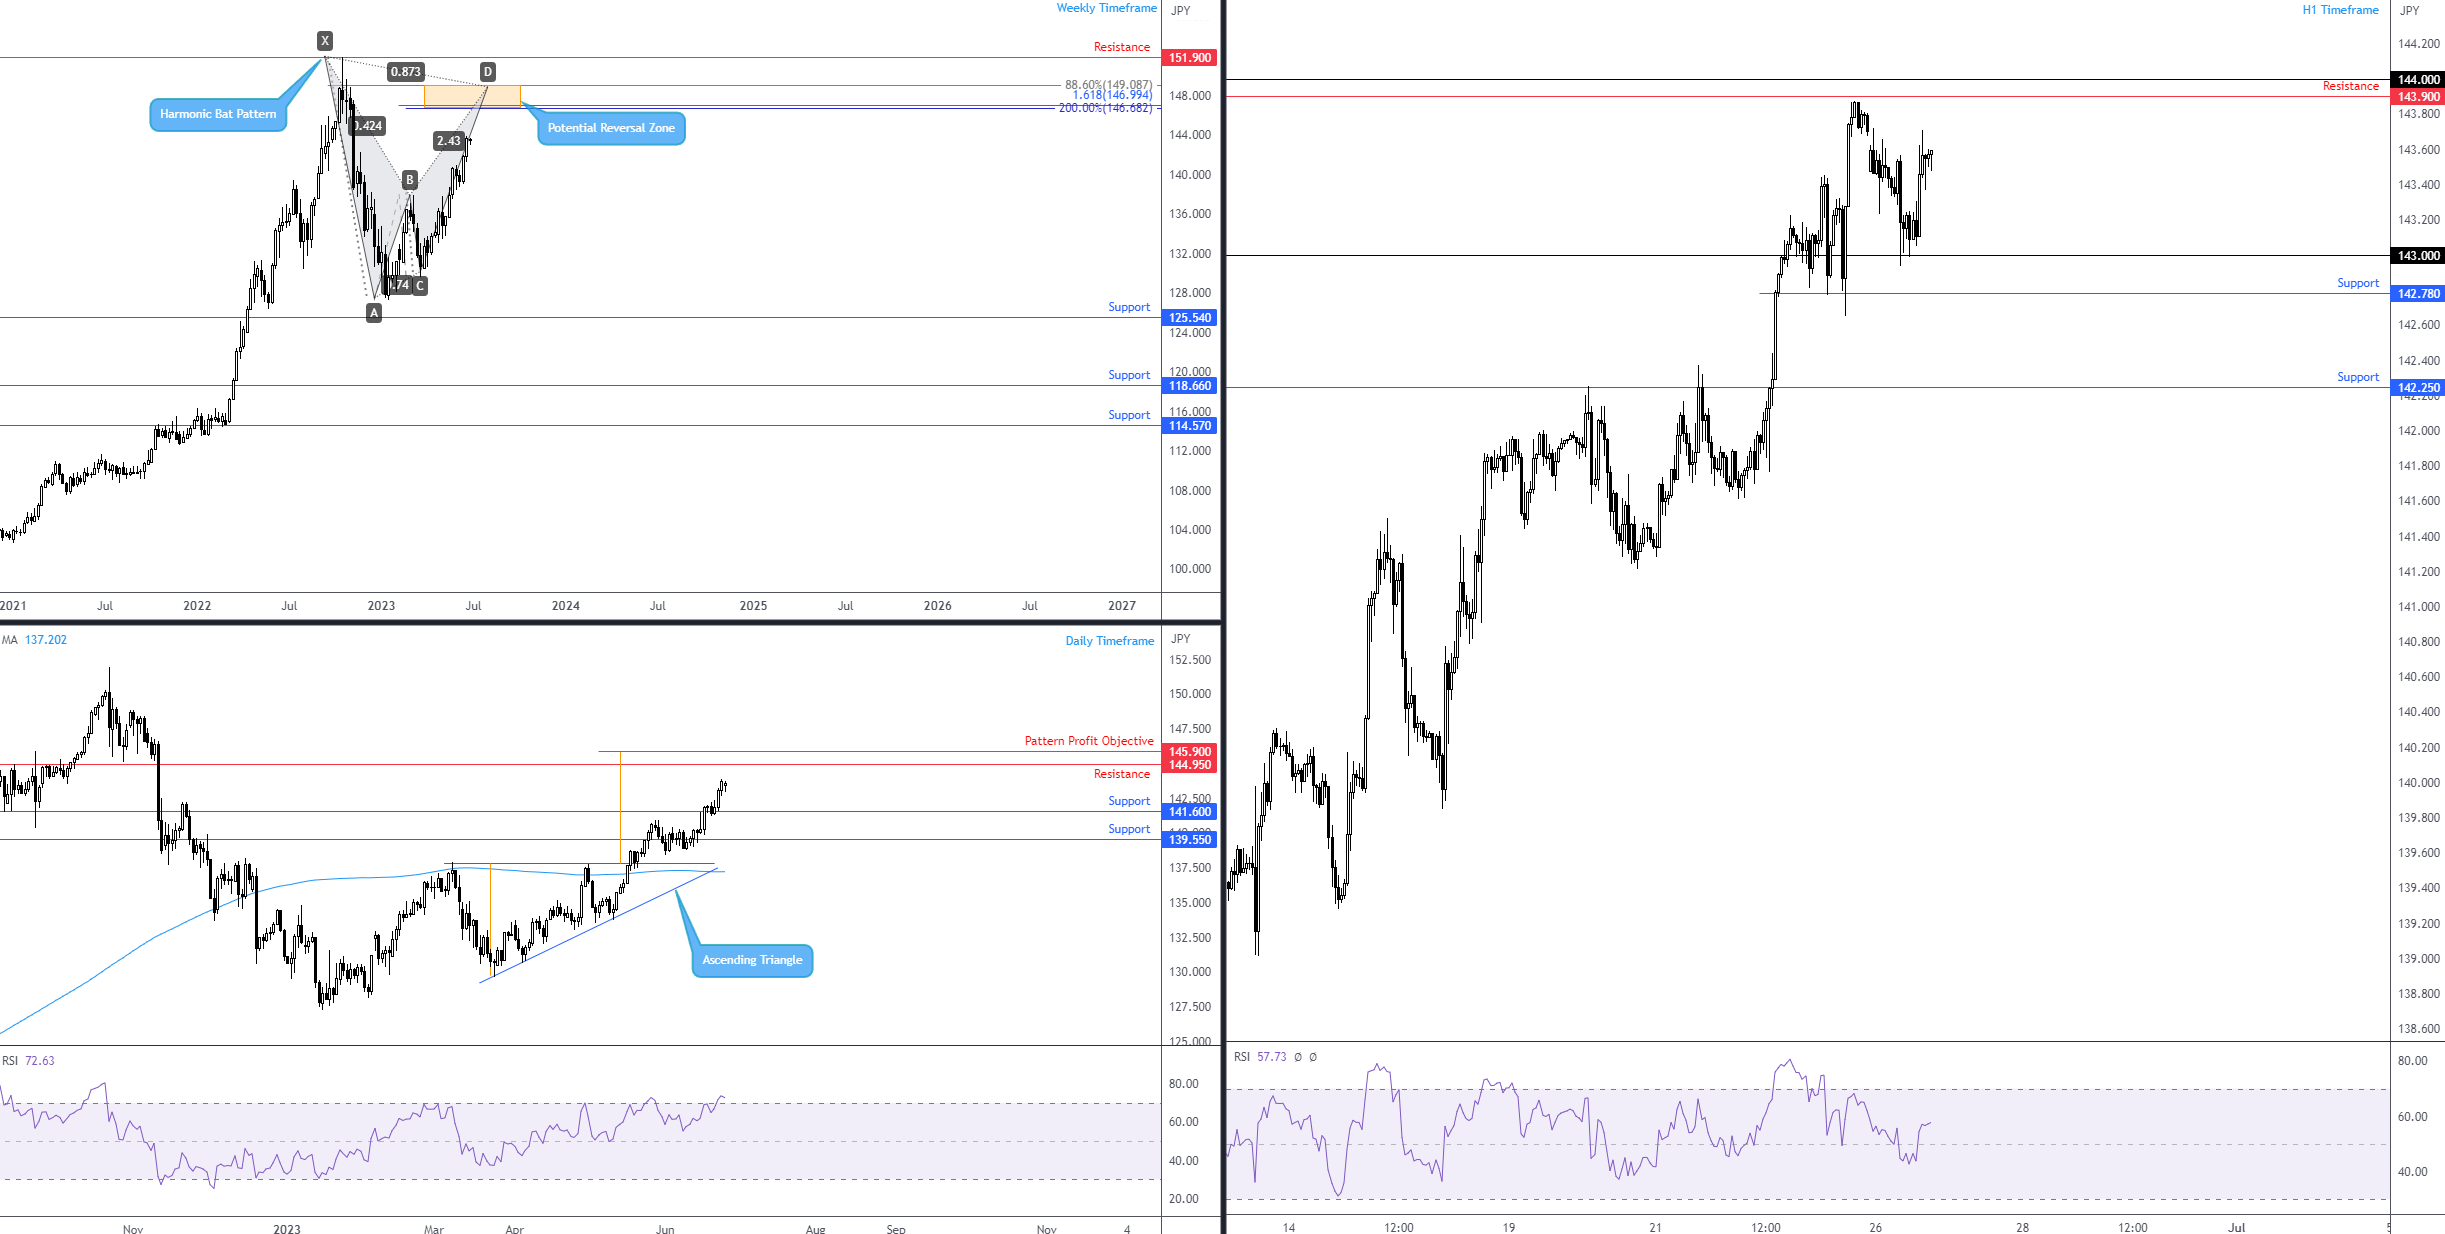
From the weekly timeframe, I see the USD/JPY eyeballing a Harmonic Bat pattern’s Potential Reversal Zone (PRZ) between ¥149.09 and ¥146.68 (made up of a deep 88.6% Fibonacci retracement ratio [the defining limit], a 1.618% Fibonacci projection [or ‘alternate’ AB=CD bearish pattern] and a 200% extension ratio). Given the limited resistance overhead on the weekly chart until the observed PRZ, additional outperformance may be on the table for the currency pair.
Moving down to the daily timeframe, last week retested a recently breached resistance level at ¥141.60 and pencilled in support. You might acknowledge that resistance calls for attention overhead at ¥144.95, with a break north of here unearthing the weekly timeframe’s Harmonic PRZ highlighted above. What is also technically interesting on the daily chart is that just above ¥144.95 resides a pattern profit objective for an ascending triangle pattern (¥137.91/¥129.64) at ¥145.90, which joins up closely with the lower side of the weekly Harmonic PRZ.

