This preview of weekly data looks at USOIL and XAUUSD, where economic data coming up later this week are the market drivers for the near short-term outlook.
Weekly data: Oil and Gold

The most important economic data for this week:
Monday:
- US Services PMI at 15:00 GMT for January. The consensus is for an increase from 50.6 points to 52. This might be rather bullish news for the dollar since it would mean the services sector in the States is still expanding, given that the actual figure will also be above the 50-point mark.
Tuesday:
- The RBA interest rate decision at 03:30 AM GMT, where the market expects interest rates to remain stable at 4.35%. In the event, however, that we have a surprise hike or cut by the Reserve Bank, then it might create minor gains or losses for the Aussie Dollar respectively.
Wednesday:
- Canadian balance of trade at 13:30 GMT, where the expectations are for a decrease reaching C$1.1bn in trade surplus. That might not significantly affect the Canadian Dollar since the data is for December and might already have been priced in.
Thursday:
- The Chinese inflation rate at 01:30 AM GMT. The market consensus is for a further decline in the already negative figure, going from -0.3% to -0.5% for January. The Chinese economy is officially in deflation since the inflation figure has been negative for the last three consecutive months, going into the fourth month if consensus is confirmed.
Friday:
- German inflation rate at 13:00 GMT. The market consensus of the final figure for January is 2.9% against the previous 3.7%. If this is broadly accurate, it could influence the final European inflation figure since the German economy is the largest in the European Union.
- Canadian unemployment rate at 13:30 GMT. The market is expecting a slight increase of around 0.1% for January. That might have a minor negative effect on the loonie if the expectations are confirmed.
_________________________________________________________________________________________
Don’t miss out the latest news, subscribe to LeapRate’s newsletter
_________________________________________________________________________________________
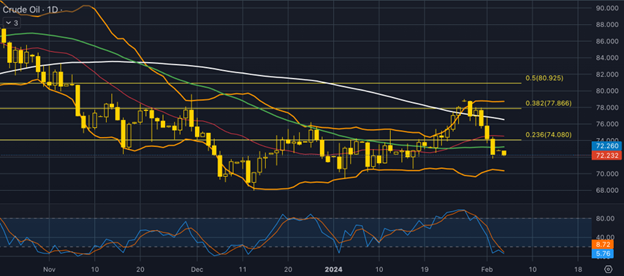
USOIL, daily
Following the recent strong US job report data where the actual figures came out to be exceptionally better than expected, the price of oil declined mainly on a strengthening US dollar. More specifically the non-farm payrolls came out at 353,000 against the expectations of 180,000 jobs, and the unemployment rate was 3.7% against the expected 3.8%. This showed market participants that the labour market in the United States still holds strong and keeps adding jobs to the market, resulting in an uptick in the dollar index (DXY) putting pressure on the instruments and currencies traded against the dollar, including crude oil. On the other hand, tensions in the Middle East continued after the US vowed more strikes for trade disturbances in the Red Sea which could boost the price of crude oil if the situation escalates.
On the technical side, the price has resumed the overall bearish momentum after finding sufficient resistance on the upper band of the Bollinger bands and is now testing the support area near the $72 price level which is the previous area of price reaction in early 2024. This correction to the downside has pushed the Stochastic oscillator to the extreme oversold level, which could potentially indicate that a correction to the upside might be visible in the following sessions while, at the same time, the faster- moving average (50 days) is trading well below the slower moving average (100 days) validating the bearish trend.
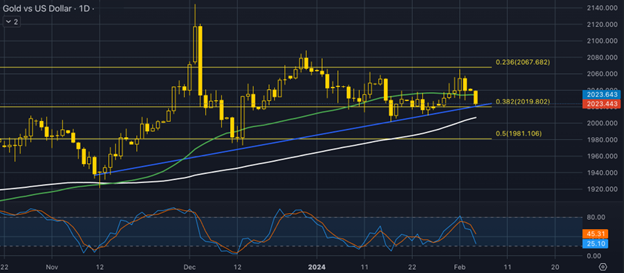
Gold-dollar, daily
The price of gold fell as the US dollar and Treasury yields surged after a strong jobs report reduced expectations of near-term interest rate cuts by the Federal Reserve. Speculators trimmed their exposure to gold futures for the fourth consecutive week, and there is uncertainty about whether gold can rally further. The odds of Fed rate cuts for 2024 have decreased, and the dollar index hit an eight-week high, making gold more expensive for holders of other currencies. Non-farm payrolls in January exceeded economists’ forecasts, leading to speculation about potential rate cuts. Despite the challenges, no immediate pressure exists to drive gold below $2,000.
From the technical point of view the gold price is currently trading at a rather interesting area on the chart consisting of 38.2% of the daily Fibonacci retracement level and the bullish trendline which has been valid since mid-November of 2023. The price level of $2,020 has proven to be a strong support area with the price not being able to break below it since mid-December of last year. Given that the Stochastic oscillator is in neutral levels and the 50-day moving average is still trading above the 100 day moving average indicating that the bullish momentum is still in place, it is possible to see a continuation to the upside in the near short term. If this holds true, then the first area of possible resistance might be found around $2,050, which is the previous high, and also the psychological resistance of the round number.
DISCLAIMER: The content of this article does not reflect the views or opinions of LeapRate

