Provided by FP Markets Chief Market Analyst Aaron Hill
Safe-haven assets caught a strong bid in recent trading, directing Spot Gold to all-time highs of US$3,220/troy ounce versus the US dollar (XAU/USD). The shift towards safe-haven markets was fuelled by softer demand for the USD as markets fled dollar assets, as well as escalating trade tensions between the US and China. Unsurprisingly, the Swiss franc (CHF) and Japanese yen (JPY) also attracted substantial bids, with the USD/CHF pair notching up losses of nearly 4.0% – its largest one-day drop since 2015!
Monthly Resistance and Oversold Conditions
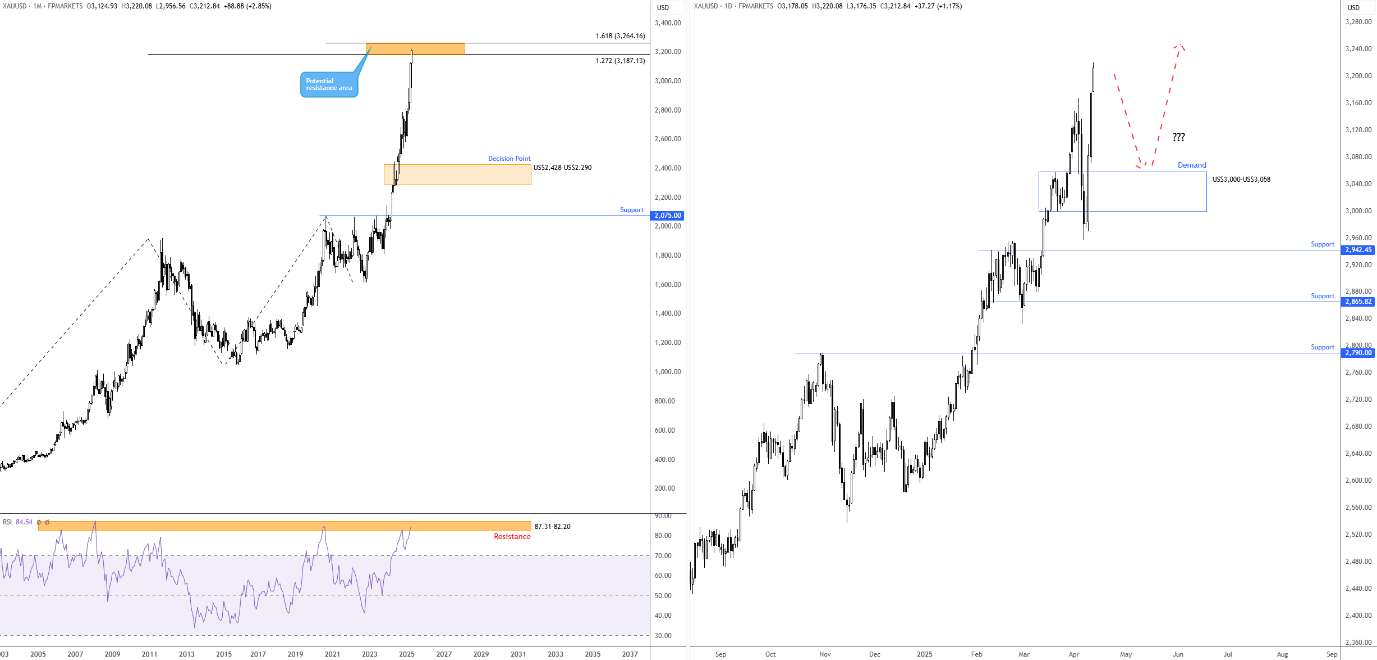
Several desks are reportedly eyeing US$3,500 as the next upside objective for Gold; however, the monthly chart reveals it is considerably overbought according to the Relative Strength Index (RSI). You will note the RSI has remained within overbought territory since mid-2024 and recently touched gloves with familiar resistance between 87.31 and 82.20. This area boasts historical significance from as far back as 2006, and each time the Index has approached the resistance, a correction/pause typically followed in the yellow metal. Consequently, it raises the question about whether buying is set to moderate/pause at the monthly resistance area between US$3,264 and US$3,187 (made up of 1.618% and 1.272% Fibonacci projection ratios, respectively)?
Daily Demand Zone; Dip-Buying?
Meanwhile, on the daily chart, price action came within a stone’s throw of testing support from US$2,942 at the beginning of the week before rallying to all-time highs noted above. What is interesting from a technical perspective is that the move left behind a demand area at US$3,000-US$3,058, which, in my opinion, represents a key technical zone.
With Gold firmly entrenched in a strong uptrend, dip-buyers could emerge from the daily demand area if a correction occurs. That said, given technical indicators on the monthly chart suggesting buyers could pump the brakes, any dip-buying activity would likely be approached with caution. Confirmation – such as a bullish candlestick signal or supporting price action on lower time frames – might be required before pulling the trigger. However, any movement below the mentioned demand area signals bearish strength from the monthly resistance zone, and potentially opens the door to short-term selling opportunities, targeting daily support at US$2,942, closely followed by support at US$2,865, and possibly US$2,790.
Charts created using TradingView
DISCLAIMER:
The information contained in this material is intended for general advice only. It does not take into account your investment objectives, financial situation or particular needs. FP Markets has made every effort to ensure the
accuracy of the information as at the date of publication. FP Markets does not give any warranty or representation as to the material. Examples included in this material are for illustrative purposes only. To the extent permitted by law, FP Markets and its employees shall not be liable for any loss or damage arising in any way (including by way of negligence) from or in connection with any information provided in or omitted from this material. Features of the FP Markets products including applicable fees and charges are outlined in the Product Disclosure Statements available from FP Markets website, www.fpmarkets.com and should be considered before
deciding to deal in those products. Derivatives can be risky; losses can exceed your initial payment. FP Markets recommends that you seek independent advice. First Prudential Markets Pty Ltd trading as FP Markets ABN 16
112 600 281, Australian Financial Services License Number 286354.