The following post is courtesy of Kiana Danial, CEO of Invest Diva, an award-winning, internationally recognized personal investing and wealth management expert. She is a highly sought-after professional speaker, author and executive coach who delivers inspirational workshops and seminars to corporations, universities and entrepreneurial groups. She is a frequent expert on many TV and radio stations and has reported on the financial markets directly from the floor of NYSE and NASDAQ. She is a weekly investment expert guest on Tokyo’s #1 Investment TV Show. She has been featured in The Wall Street Journal, TIME Magazine, CNN, Forbes, The Street, – and numerous other publications.
Today I’m going to talk about my Japanese love. And no, I’m not having an affair with a Japanese guy … at least, in the real world. In the virtual world, I’ve been in a relationship with Mr. Ichimoku, or Ichimoku-San, for over 8 years. I’ve also been sharing my Ichimoku-based trading strategies and virtual love stories with the Invest Diva community.
Ichimoku Kinko Hyo(一目均衡表) is one of my favorite indicators in technical analysis. I initially learned about it first-hand from the Japanese. Over my years of technical analysis and trading, and teaching courses at Invest Diva, in Japan and in universities in New York, this one indicator has proven to be one of the best predictors of future movements, especially as a key part of medium to long-term investment strategies.
After enrolling in the NYU School of Professional Studies to become a Certified Financial Planner, I started thinking of methods to combine Ichimoku interpretations with Fibonacci retracement levels to create strategies based on traders’ risk tolerance and financial goals. What you will learn in Ichimoku Secrets, are real examples of Ichimoku-based strategies that have and have been successful in the past.
You must know that some Wall Street insiders and professional traders are irritated by that fact that I’ve put the Ichimoku Secrets out in the world. There are many components to Ichimoku; however, only the combination of a few components has been my main secret to trading success… Up until now only premium Invest Diva students have had access to this. I am going to reveal it to you in my new book, as well as trading power course, Ichimoku Secrets.
I will cover the best time frames to use Ichimoku, as well as best practices and combinations with Fibonacci retracement levels to develop a strategy that best suits your risk tolerance and financial goals.
Ichimoku is short for Ichimoku Kinko Hyo, which can be translated as “a glance at a chart in balance”.
A Japanese journalist called Goichi Hosoda invented this charting technique in 1936, and since then Ichimoku charts have become a popular trading tool in Japan.
Of course, love at first sight can be complicated. But once you get to know it, magic can happen. Before we reveal the chart, let’s prevent a major brain meltdown by first introducing the stuff you are going to see on your chart when you insert Ichimoku onto it.
Now we are going to add all these lines and moving averages to our trading chart.
Don’t panic; your eyes are going to get used to this, and after one day you will feel that a chart without Ichimoku is totally naked.
Here is basic introduction to Ichimoku Kynko Hyo elements:
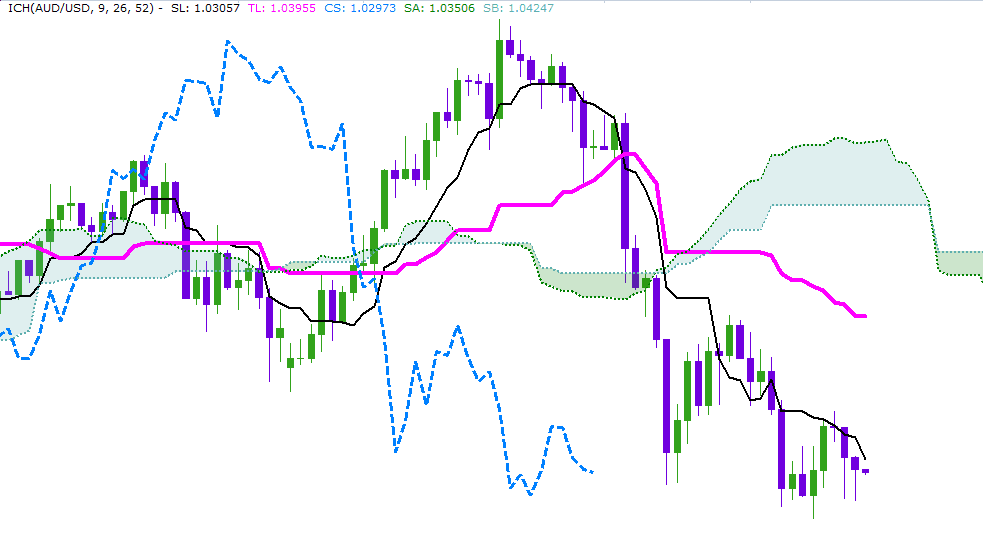
Kijun line (base line in solid, thick pink color). This is the average of the highest high and the lowest low within the past 26 candles. We can also call it the “slow line” because it reflects a whole 26 periods.
Tenkan line (turn line, solid, thin black color). This is the average of the highest high and the lowest low within the past 9 candles. We can also call this the “fast line” because it reflects less periods.
Chiko (sometimes spelled chikou) span (delayed line, thick, dashed blue color). This shows the most recent candle’s price, but it is drawn 26 periods behind.
Kumo (cloud). This is the area between two lines that plots the future! The first thin, dotted line is calculated by averaging the tenkan line and the Kijun line plotted 26 periods ahead. The second one is determined by averaging the highest high and the lowest low for the past 52 periods plotted 26 periods ahead. These two lines are called Senkou spans. Senkou means “future”.
One good thing about modern trading, including those of Forex, stocks, equities and even ETF platforms, is that you can choose different colors for each of the Ichimoku lines to make your Ichimoku indicator more colorful and to identify the lines easily.
The general interpretation for Ichimoku is very commonly shared on the Internet and in many books. For example, If the candles are above the cloud, it is considered a buy signal, if it is below the cloud, it is considered a sell signal. If the Tenkan line crosses above the Kijun line, it is a bullish indication… and if it crosses below the Kijun line, it can be a bearish indicator. While these can certainly be beneficial for traders who like indicators, Ichimoku Secrets dives much, much deeper than this.
Not only I’ll reveal trigger and confirmation signals on different time frames, but the most important aspect of it is the ability to adjust the Ichimoku strategy to YOUR risk tolerance and YOUR portfolio.
Every trader has different financial goals, different margin and different positions in the market. I have divided the Ichimoku based strategy into three different categories: High, medium and low risk. Then by combining Ichimoku with Fibonacci retracement levels, you will be able to pick the strategy that best suits you, at a given time.
So, I know this was very basic and you probably crave for a lot more but the good news is that we’re really close to wrapping up our long-awaited Ichimoku secrets power course in English. We already did the course in Japan and it was really successful. And while you can already purchase the Ichimoku Secrets book, we’ll be releasing the course end of February.


